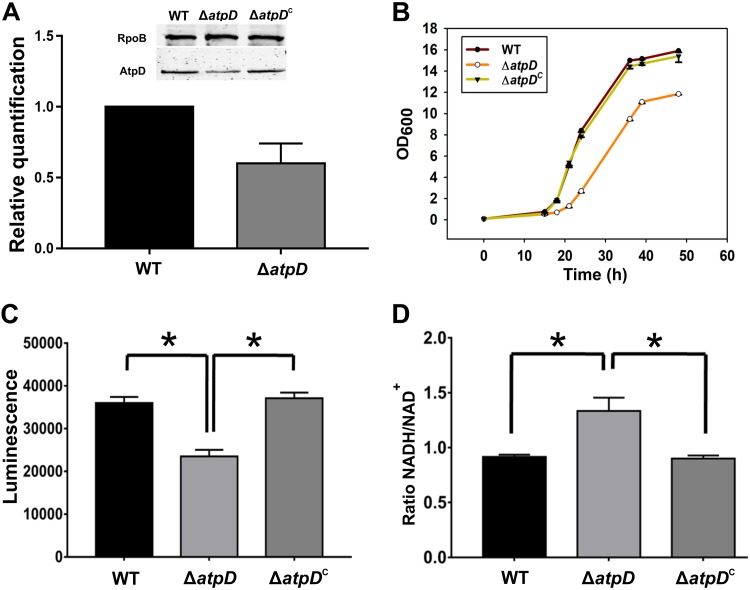
FIG 1.
Monitoring of the expression of atpD, growth, and energy level in the M. smegmatis strains. (A) The plot shows the RT-qPCR-based atpD expression data obtained from the wild-type and the atpD-knockout strains of M. smegmatis. (Inset) Western blot of the AtpD protein in the wild-type, ΔatpD, and ΔatpDC strains. Western blotting was performed with anti-AtpD antibody, and the RNA polymerase anti-RpoB (β-subunit) antibody was used as a loading control. The experiment was repeated at least thrice; only one representative image is shown here. (B) Growth analysis of the WT, ΔatpD, and ΔatpDC strains in MB7H9 broth supplemented with 2% glucose as a carbon source at 37°C. The knockout grew slower than the other two bacteria. (C) Intracellular ATP estimation in the WT, ΔatpD, and ΔatpDC strains, plotted as luminescence. A reduced ATP level, in the form of lower luminescence in the ΔatpD strain than in the WT strain and the complemented strain, was observed. (D) Cellular NADH/NAD+ ratio in all three strains. In all panels, the data represent averages from at least three independent experiments, with standard deviations shown as error bars. *, a P value of ≤0.05 was considered significant.

