FIG 2.
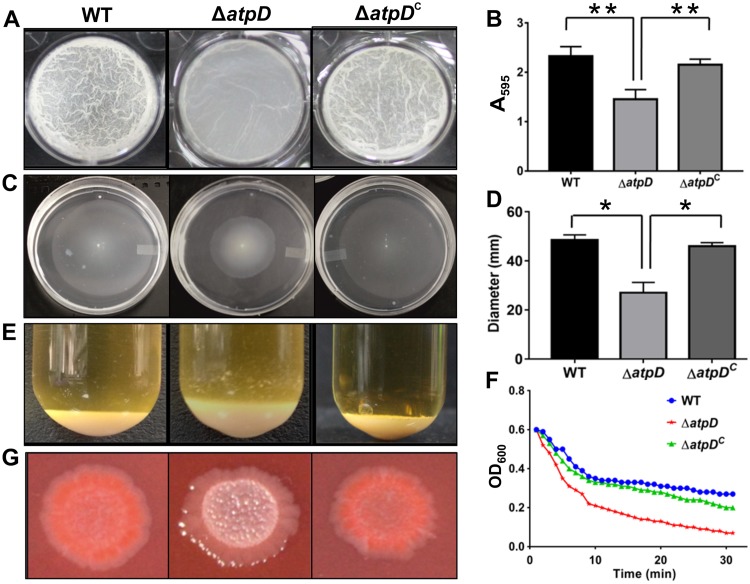
Phenotypic characterization of the atpD-knockout strain of M. smegmatis. A comparison of the phenotypes obtained for the WT, ΔatpD, and ΔatpDC strains under different assay conditions is shown. (A) The 7-day-old biofilm formed at the liquid-air interface in the presence of glucose as the carbon source by the three bacterial strains. (B) The graph shows the quantification of the biofilms performed using the crystal violet dye assay. The absorbance measured at 595 nm in each case is plotted. The data show that the mutant forms less biofilm than the WT and the complemented strains. (C) Sliding motility, monitored after 3 days of incubation at 37°C, is shown for all three strains. (D) The zone occupied by each bacterium on the agar plate was measured in millimeters and plotted. The mutant showed less sliding motility than the wild-type and the complemented strains. (E) The cellular aggregation profiles of the three strains. The mutant bacterium clearly showed a larger amount of cellular aggregation than the other two strains. (F) Aggregation of the indicated strains, as measured in the form of the change in OD600 values over a period of time after suspension of the cells in detergent-free medium, is plotted. The knockout strain showed higher aggregation with time than the other two strains. (G) The colony morphology of all three bacteria on a Congo red agar plate is shown. The mutant did not retain the red color in this assay. For all panels, experiments were carried out at least thrice; only one representative image is shown in each of panels A, C, E, F, and G. In panels B and D, the data are representative of those from three independent experiments, with error bars representing standard deviations. *, P ≤ 0.05; **, P ≤ 0.01.

