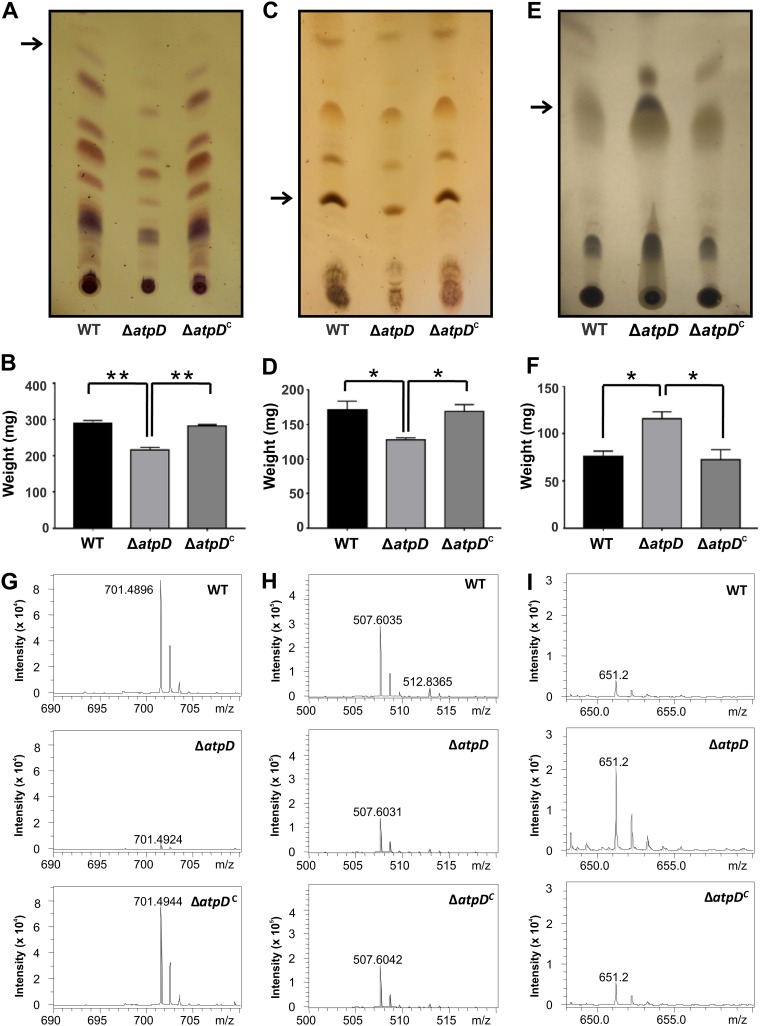
FIG 3.
Comparison of the GPL, polar lipid, and apolar lipid profiles. Thin-layer chromatograms, quantification, and mass spectrometry data are shown for GPLs (A, B, and G), polar lipids (C, D, and H), and apolar lipids (E, F, and I). The lipids were extracted from the M. smegmatis wild-type (WT), atpD-knockout (ΔatpD), and complemented (ΔatpDC) strains. (A) TLC of the GPLs shows remarkable differences for the atpD-knockout strain. (B) Quantification of the GPLs shows lower values for the knockout strain. (G) Further, the ESI-MS data correspond to those for the band extracted from the TLC (marked with an arrow in panel A). Only one representative peak is shown; complete mass spectrometric data are available in Fig. S6 in the supplemental material. (C) Similarly, TLC of the polar lipids shows remarkable differences for the atpD-knockout strain. (D) Quantification of the polar lipids shows lower values for the knockout strain. (H) Further, the ESI-MS data correspond to those for the band extracted from the TLC (marked with an arrow in panel D). Only one representative peak is shown; complete mass spectrometric data are available in Fig. S7. (E) TLC of the apolar lipids shows remarkable differences for the atpD-knockout strain. (F) Quantification of the apolar lipids shows higher values for the knockout strain. (I) Further, the ESI-MS data correspond to those for the band extracted from the TLC (marked with an arrow in panel E). Only one representative peak is shown; complete mass spectrometric data are available in Fig. S8. For the experiments whose results are presented in panels A, C, and E, the experiments were repeated at least thrice, and only one representative image is shown in each case. In panels B, D, and F, the error bars represent standard deviations. *, P ≤ 0.05; **, P ≤ 0.01.

