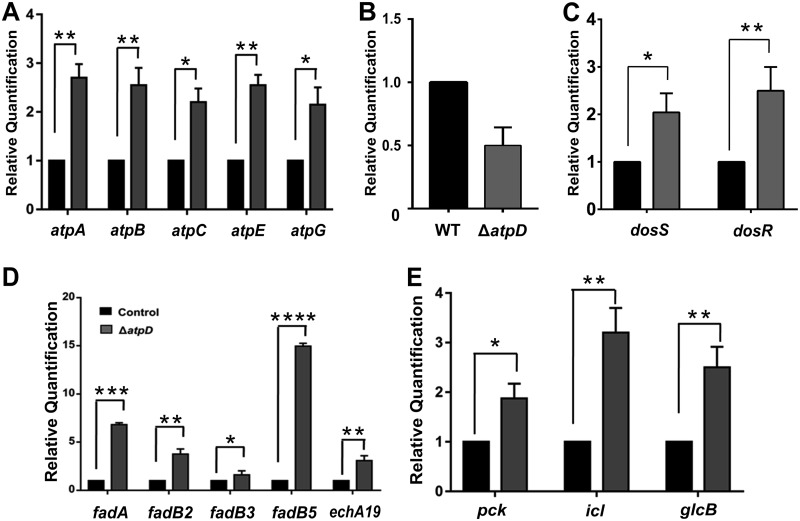
FIG 8.
The atpD-knockout strain shows modulation of major metabolic pathways. (A to C) The relative mRNA transcript levels of ATP synthase operon genes atpA, atpB, atpC, atpE, and atpG (A), MSMEG_3630 (B), dormancy operon genes dosS and dosR (C), (D and E) β-oxidation pathway genes fadA, fadB2, fadB3, fadB5, and echA19 (D), and central metabolic pathway enzyme genes pck, icl, and glcB (E), as assessed by RT-qPCR, are shown. In each panel, the transcript level in the atpD-knockout strain is compared with that in the wild type, which was used as a control. The experiments in each case were performed at least thrice. The error bars represent standard deviations. *, P ≤ 0.05; **, P ≤ 0.01; ***, P ≤ 0.005; ****, P ≤ 0.001.

