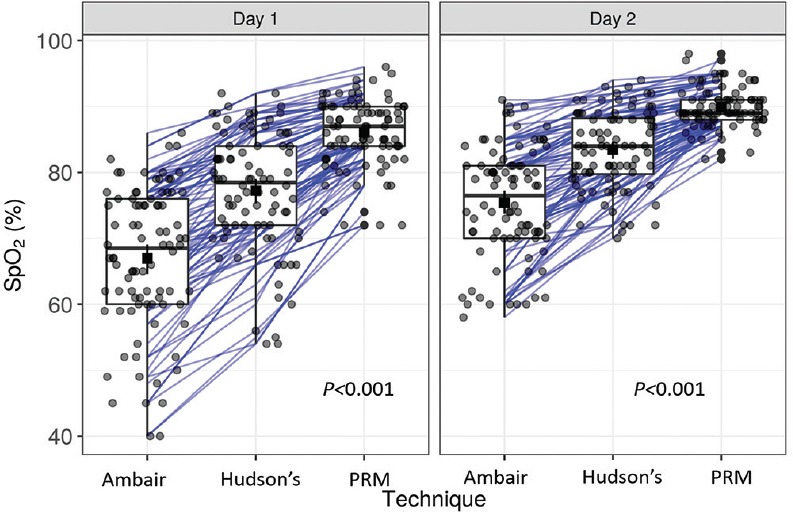
Fig. 2.

Boxer plot with different oxygen delivery systems on days one and two. Square dots with bars, Mean with 95% confidence interval. SpO2, Peripheral capillary oxygen saturation; Ambair, ambient air; Hudson's, Hudson's mask; PRM, partial rebreathing mask.
