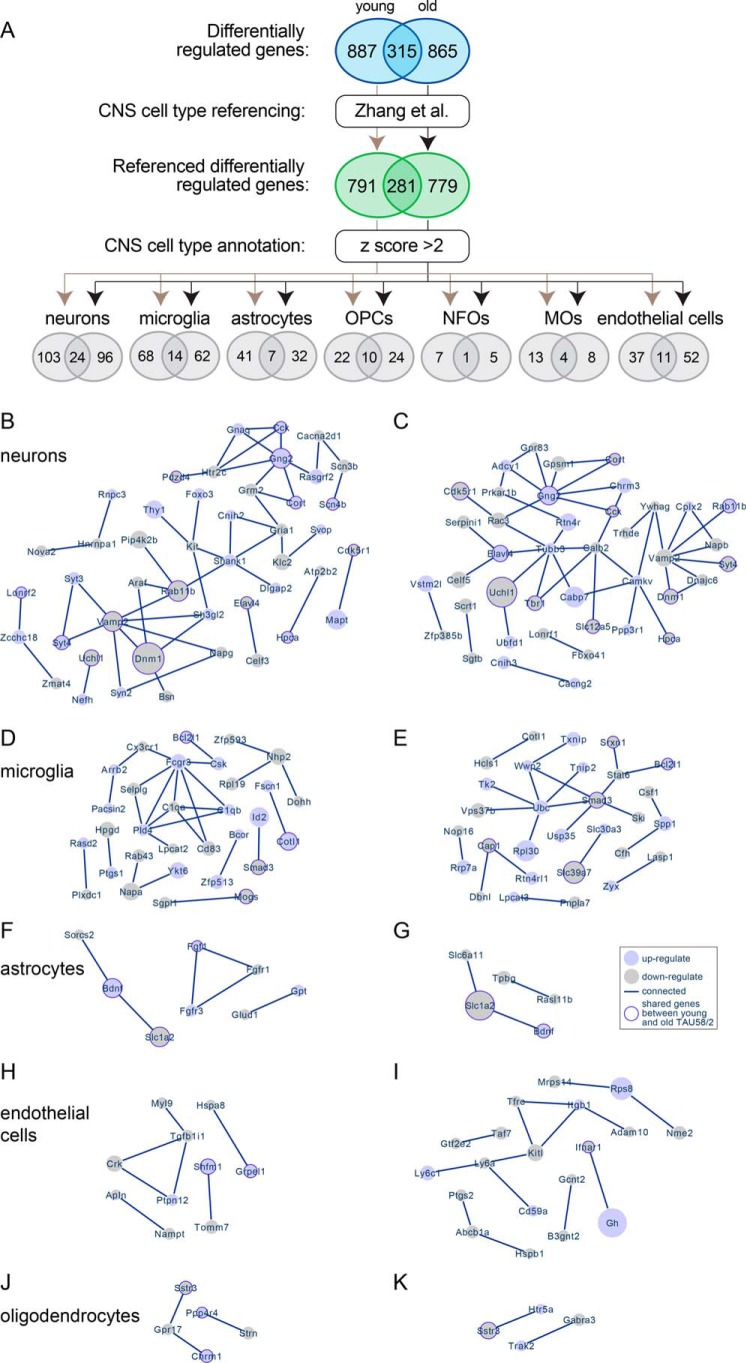
Figure 2.
Annotation of differentially-regulated genes to CNS cell types. A, process schematic for annotation of differentially-regulated genes from young and old TAU58/2 mice to CNS cell types by referencing to a previously published dataset (Zhang et al. (20)). Ellipses indicate number of genes at each step, including overlapping differentially expressed genes between young and old TAU58/2 mice. B and C, predicted networks of differentially expressed genes annotated to neurons in young (B) and old (C) TAU58/2 mice. Light-blue–filled circles indicate up-regulated genes, and light-gray–filled circles indicate down-regulated genes. The size of filled circles indicates relative degree of deregulation (large = highly deregulated and small = moderate deregulation as compared with gene expression in nontransgenic controls). Dark-blue borders indicate deregulation in both young and old TAU58/2 mice. Lines indicate connection predicted by STRING analysis. D and E, predicted networks of differentially-regulated genes annotated to microglia in young (D) and old (E) TAU58/2 mice. F and G, predicted networks of differentially expressed genes annotated to astrocytes in young (F) and old (G) TAU58/2 mice. H and I, predicted networks of differentially-regulated genes annotated to endothelial cells in young (H) and old (I) TAU58/2 mice. J and K, predicted networks of differentially expressed genes annotated to oligodendrocytes in young (J) and old (K) TAU58/2 mice.

