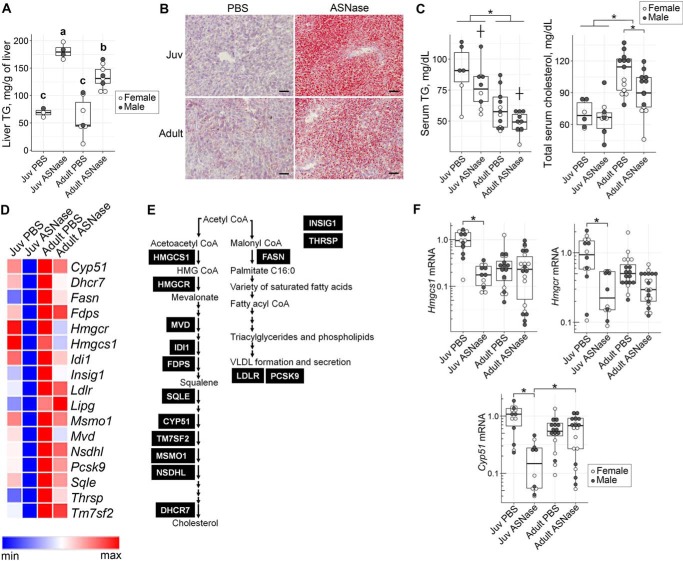
Figure 3.
Age affects lipid metabolism in response to ASNase. Hepatic triglyceride (TG) measurement (A) and Oil Red O staining (B) of liver (scale bar, 100 μm) show larger accumulation of red droplets representing hepatic TG in juveniles (Juv) as compared with adults. Data in A were evaluated by two-factor ANOVA with ASNase and age as independent factors. Means not sharing a common letter are different, reflecting an ASNase × age interaction, p < 0.05. C, serum TG and total cholesterol in sera of mice exposed to either ASNase or to PBS vehicle. Data in C were evaluated by two-factor ANOVA. *, significant effect of age (p < 0.05); †, significant effect of ASNase (p < 0.05). D, heat map showing genes of the lipid biosynthesis pathway that were significantly altered in expression by ASNase in the juveniles (padj < 0.1), but not the adults. The blue-to-red color scale represents mRNA abundances obtained from RNA-Seq data across the four treatment groups. For exact expression values and corresponding protein function, see Table S1B. E, diagram indicates enzymes of the lipid biosynthesis pathway encoded by genes from D. F, validation of Hmgcs1, Hmgcr, and Cyp51 mRNA abundances by RT-qPCR. Values are normalized to the ones of the juvenile PBS control group. The box plots show median values, top and bottom hinges correspond to the first and third quartiles (the 25th and 75th percentiles), and the whiskers extend to the smallest and the largest value within 1.5 distance of the interquartile range. *, p < 0.05 by Wilcoxon rank-sum test.

