Figure 7.
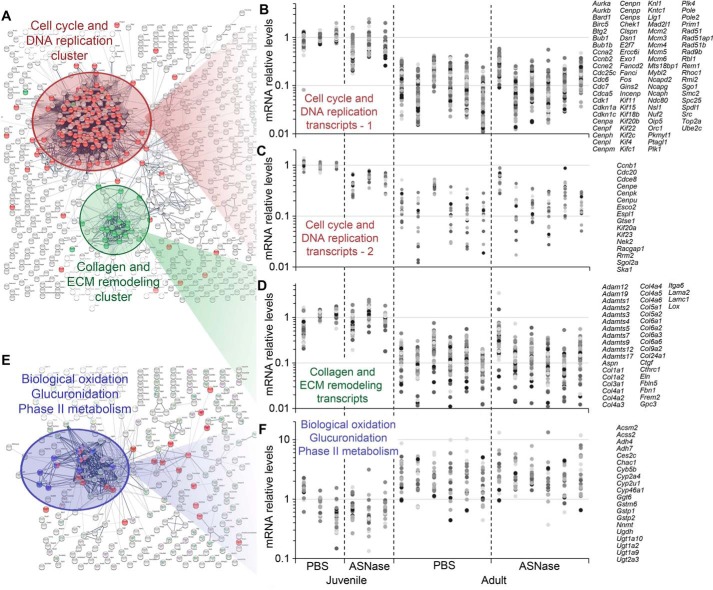
Functional association analysis of genes affected by maturity to adulthood revealed three large clusters. A, genes whose expression is down-regulated during maturity to adulthood encode proteins that regulate cell cycle/DNA replication (red) and proteins that constitute extracellular matrix (ECM) and its remodelers (green). B and C, graphs showing abundances of transcripts functionally associated with the cell cycle/DNA replication cluster. B, transcripts with abundances decreased at least 2–3-fold by ASNase in the juveniles; C, transcripts with abundances not affected by ASNase. D, transcripts of the ECM remodeling cluster decreased in abundance 2–10-fold during maturity to adulthood. E, genes whose expression is up-regulated during maturity to adulthood encode proteins catalyzing oxidation reactions, glucuronidation, and other reactions of the phase II metabolism. F, graphs showing abundances of transcripts functionally associated with the collagen and ECM remodeling cluster increased 2–10-fold during maturity to adulthood. B, C, D, and F share a common x axis comprising individual animals within each treatment group for a total of 18 animals whose transcriptomes were sequenced. Dots colored in different shades of gray represent mRNA abundances for genes from the corresponding clusters. All of the expression values in these panels are normalized to the average value of the juvenile (Juv) PBS control group. Lists of genes are given on the right side of each panel. For exact expression values and corresponding protein functions, see Table S2.

