
Figure 4.
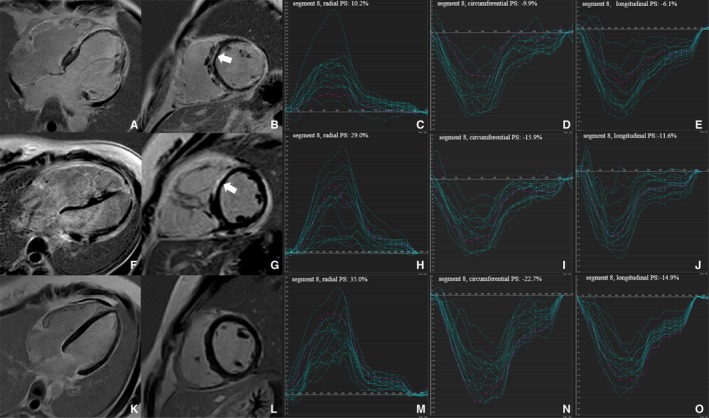
Representative cases of left ventricular (LV) segmental peak strain and late gadolinium enhancement according to AHA 16‐segment model from the reduced left ventricular ejection fraction group (A through E), the preserved left ventricular ejection fraction group (F through J) and the controls (K through O), respectively. Late gadolinium enhancement images were demonstrated in the 4‐chamber (A, F, and K) and mid‐short‐axis (B, G, and L) view, respectively. The white arrow (B and G) indicates late gadolinium enhancement in the segment 8 (LV mid‐anteroseptal wall). LV 16‐segment PS curves were shown in the radial (C, H, and M), circumferential (D, I, and N), and longitudinal (E, J, and O) directions, respectively. The red‐color curves indicate the PS curves of segment 8 (LV mid‐anteroseptal wall) in 3 groups, respectively. AHA indicates American Heart Association; LGE, late gadolinium enhancement; LV, left ventricular; LVEF, left ventricular ejection fraction; PS, peak strain.