
Figure 8.
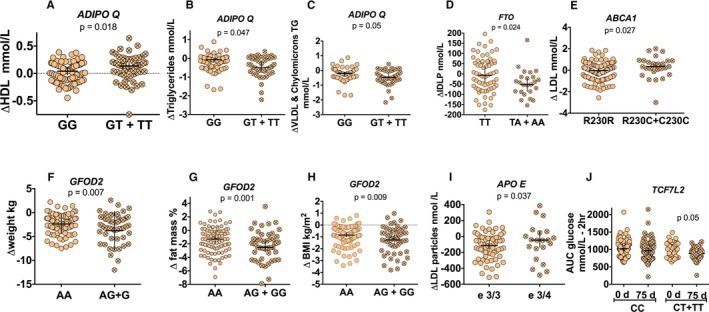
Effect of a lifestyle intervention on changes in anthropometric and biochemical parameters, according to the presence of specific polymorphisms in patients with metabolic syndrome. A, High‐density lipoprotein (HDL) cholesterol. B, Triglycerides. C, Very‐low‐density lipoprotein (VLDL) and chylomicron triglyceride concentration after dietary strategy, according to the presence of ADIPOQ genotype. D, Serum intermediate‐density lipoprotein (IDLP) after dietary strategy, according to the presence of FTO genotype. E, Serum LDL cholesterol after dietary strategy, according to the presence of ABCA1 genotypes. F, Weight. G, Fat mass. H, Body mass index (BMI) after dietary strategy, according to the presence of GFOD2 genotypes. I, Serum LDL particles after dietary strategy, according to presence of APOE isoforms. J, Serum area under the curve (AUC) of glucose after dietary strategy, according to presence of TCF7L2 genotypes.