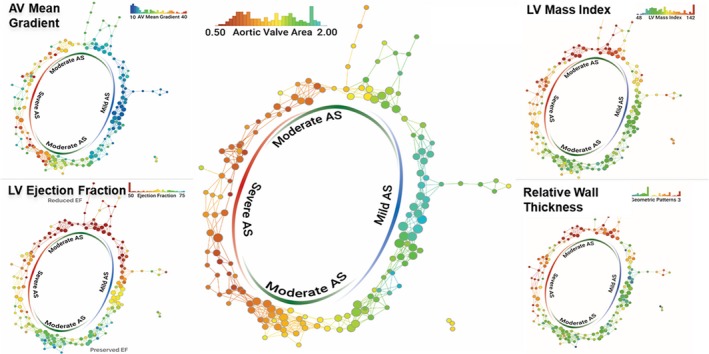
Figure 4.

Topological data analysis in patients with AS. Topological data analysis enables integration of multidimensional complex data and visualization of hidden patterns in the data. Each node represents 1 or more patients with similar echocardiographic parameters of AS, and nodes including similar patients are connected by edges. Each panel is colored by 1 parameter written on the top right and color of the nodes represents the mean value of the parameter in the nodes. Although the network was created only from the parameters of aortic stenosis, preserved and reduced LV function (systolic and diastolic) were segregated in different regions. AS indicates aortic stenosis; AV, aortic valve; LV, left ventricle. Reprinted from Casaclang‐Verzosa et al19 with permission. Copyright ©2019, Elsevier.
