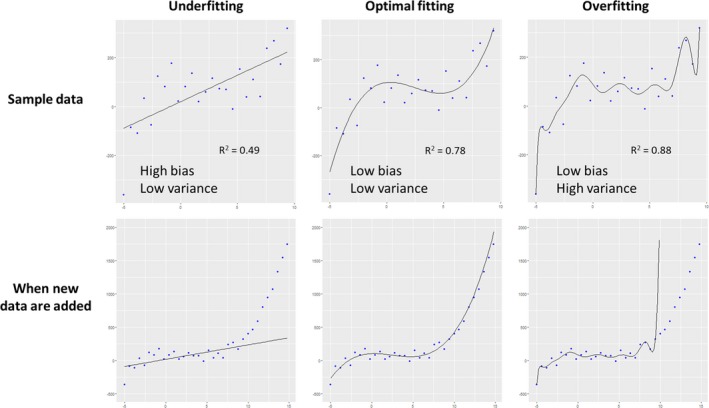
Figure 5.

Underfitting, optimal fitting, and overfitting. The upper row shows regression models created in sample data (=training data), and new data from the same population were added in the bottom row. A simple linear model on the left panel was underfitted to the data, with low variance (ie, fluctuations in predicted value) but high bias (ie, difference between predicted and true value). In contrast, a complex model on the right panel was overfitted with low bias but high variance, because it also modeled random noise in the sample data. As a model becomes more complex, goodness‐of‐fit increases and bias decreases. However, overfitted models do not capture real association in data and cannot work well for new data.
