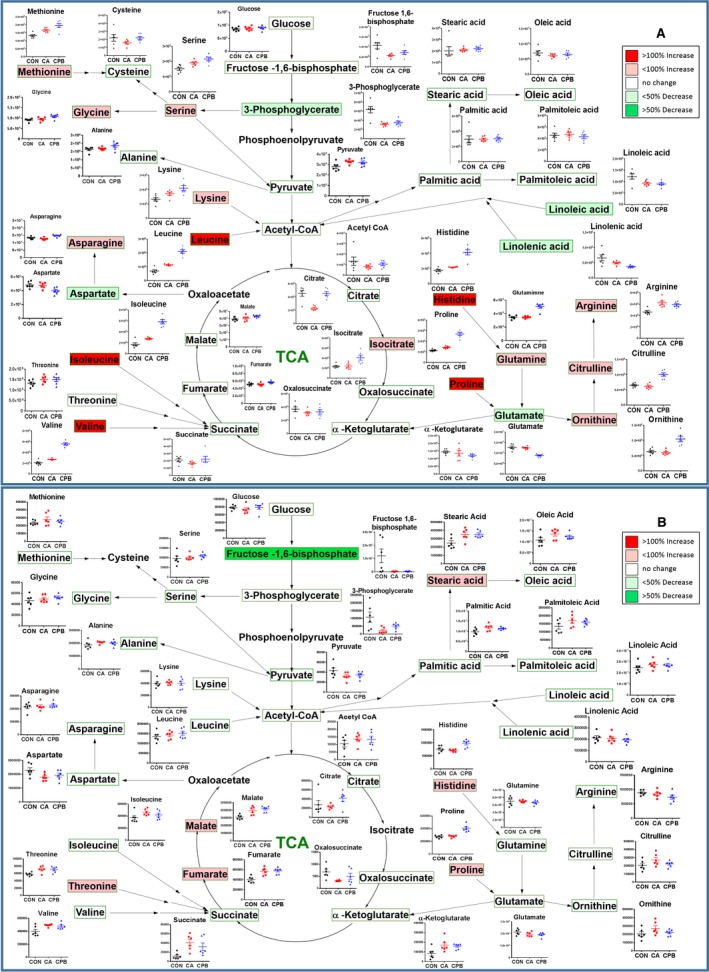
Figure 3.

Assembly of the major metabolic pathways in the brain (A) and heart (B). Postresuscitation metabolites are shown, with the corresponding changes from control to cardiac arrest to resuscitation shown in graphs adjacent to respective metabolites. The colors correspond to the level of metabolites after resuscitation: red is increased levels, while green is decreased levels. TCA indicates tricarboxylic acid.
