Figure 5.

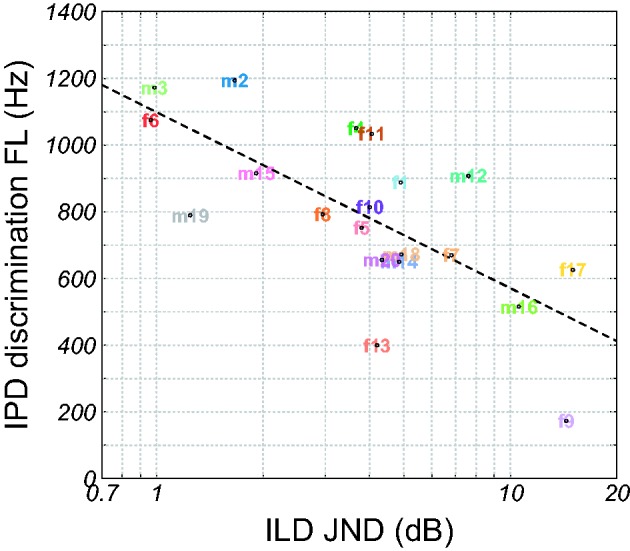
IPD discrimination FL as a function of the ILD JND at 500 Hz. The dashed curve shows a linear regression line. IPD = interaural phase difference; JND = just-noticeable difference; ILD = interaural level difference; FL = frequency limit.

IPD discrimination FL as a function of the ILD JND at 500 Hz. The dashed curve shows a linear regression line. IPD = interaural phase difference; JND = just-noticeable difference; ILD = interaural level difference; FL = frequency limit.