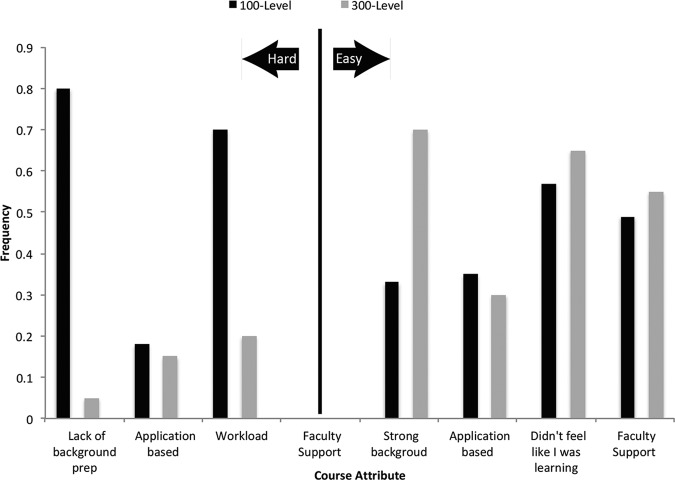
FIGURE 4.
Student self-reports from selected “choose from” response items of what makes a course hard or easy. The left side of the graph corresponds to hard attributes, and the right side of the graph corresponds to easy attributes. 100-level students (black, n = 90) identify lack of preparation and workload as reasons courses were hard. Both 100- and 300-level students acknowledge the required application of course content contributed to its difficulty. 300-level students (gray, n = 40) attributed courses as easy due to their background and the “ease“ of learning (I didn’t feel like I was learning).

