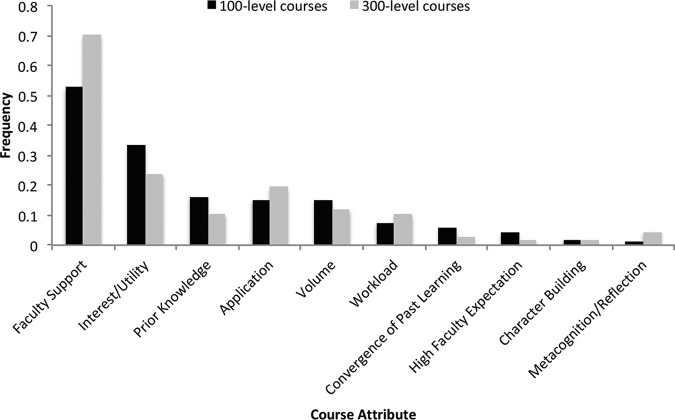
FIGURE 7.
Comparison of 100- and 300-level student responses to courses wherein they learned the most. Bars represent frequencies of response. Both 100- and 300-level students identified faculty support as being key in a course in which they learned the most. In addition, courses in which they did not have a lot of initial knowledge but had high interest and saw strong practical application resulted in their perception of learning the most.

