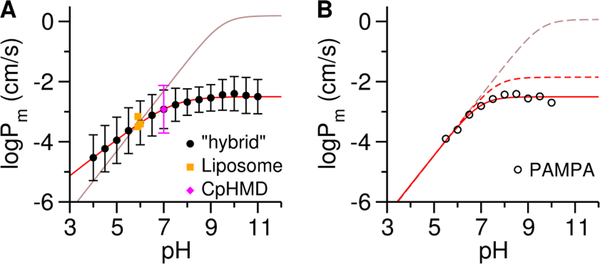
Figure 4. pH-dependent permeability coefficient (Pm) of PPL.
(A) Comparison of the calculated “hybrid” (●) and experimental liposome Pm values (orange ■).88–89 The red solid line is the best fit of the “hybrid” Pm to eq. 2. The brown solid line was predicted from eq. 1. (B) Reassessment of the experimental PAMPA Pm values  .110 The solid red line is the best fit to eq. S10. The dashed lines refer to the corrected for the aqueous boundary layer (brown based on eq. 1 and red based on eq. 2, check the Supporting Information section 3.2 for details).

