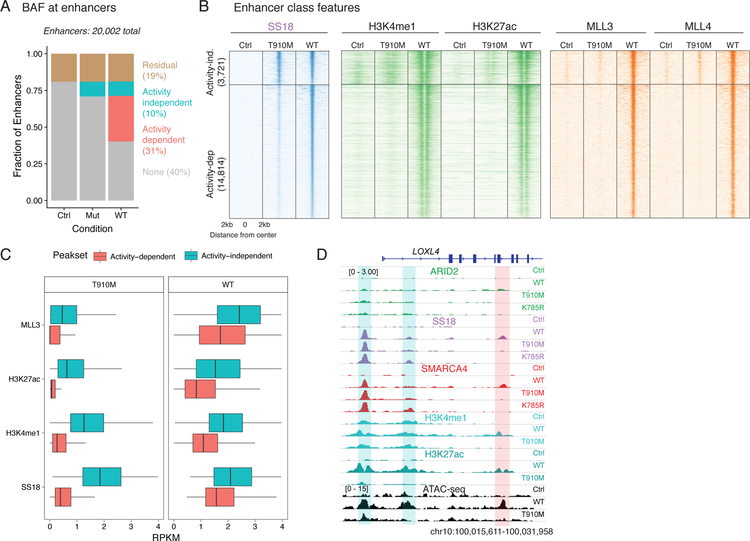
Figure 4.
Defining catalytic-dependent and -independent targeting of BAF complexes at enhancers.
A. Proportion of active enhancers occupied by BAF upon control and ATPase rescue.
B Heatmap showing each enhancer (ordered by SS18 occupancy) and the ChIP-seq profiles of H3K4me1, H3K27ac and MLL3/4.
C. Boxplot of ChIP-seq readcounts for MLL3, H3K27ac, H3K4me1 and SS18 epitopes over activity-independent (n=3,721) and -dependent (n=14,814) peaks across T910M and WT rescues. First and third quartiles are denoted by lower and upper hinges. Whiskers extend to the smallest and largest values within 1.5x the interquartile range from the lower and upper hinges.
D. Example browser track for the LOXL4. Activity-independent sites are highlighted in blue while activity-dependent sites are shown in red.

