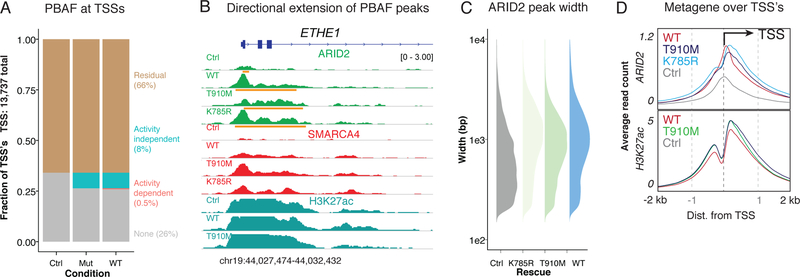
Figure 5.
Directional PBAF complex occupancy along transcriptional initiation signatures requires the ATPase module, but not ATPase activity.
A. Proportion of active TSS’s occupied by PBAF (within 4 kb) upon control and ATPase rescue.
B. Example browser track for ETHE1, whose TSS is occupied by a narrow ARID2 peak in the control condition and wide ARID2 peaks upon ATPase subunit rescue. Broad peaks called by MACS 2.0 are shown in orange under ARID2 tracks.
C. Peak width distributions of ARID2 peaks called upon rescue of mutant and WT SMARCA4.
D. Metagene plot of ARID2 and H3K27ac occupancy over TSS’s.

