
Fig. 5.
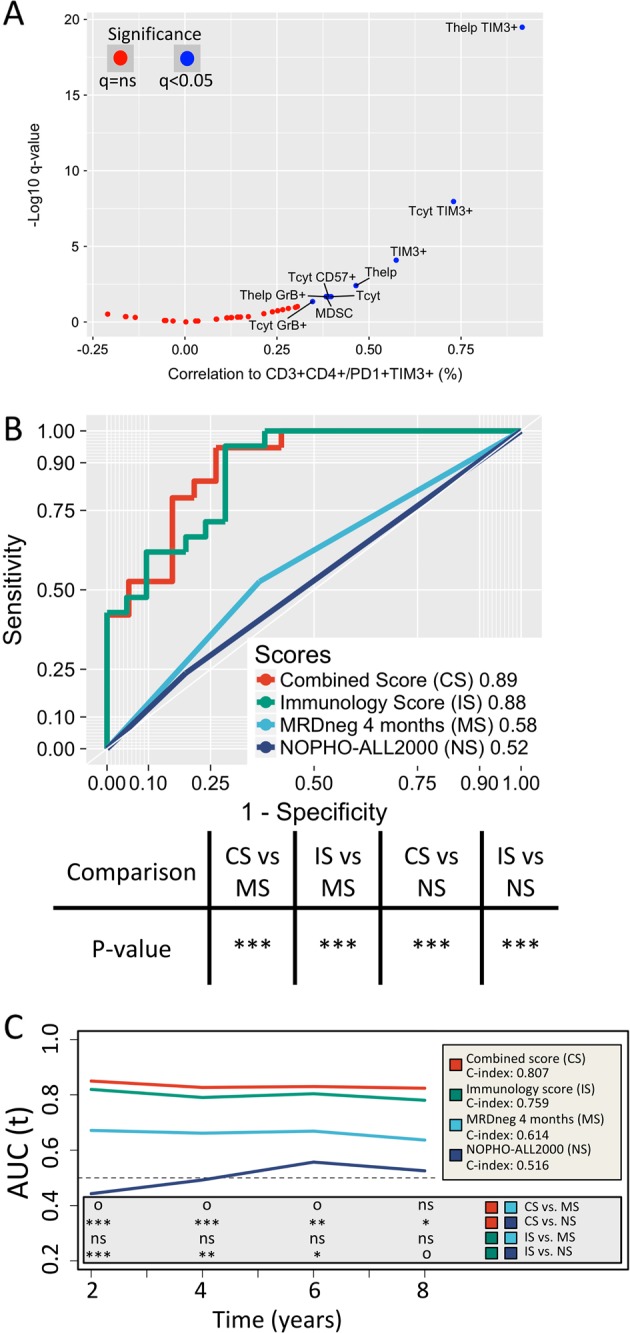
a The correlation between CD4+PD1+TIM3+ T cell count and other immune cell phenotypes. Significant values (q < 0.05, Spearman correlation) are annotated in blue. To determine the prediction power of b RFS, area under the receiver operating characteristic curves (AUROC) of our model (green line) was compared to stratification by MRD status at 4 months (light blue line) with the bootstrap method (number of iterations: 4000). Similarly, a combination of both models (red line) was developed and compared to stratification by MRD status at 4 months and original study protocol stratifications (dark blue line). Symbols for significance of the comparison: *P < 0.05, **P < 0.01, ***P < 0.001. c The time-dependent receiver operating characteristic (ROC) curves (IPCW [inverse probability of censoring weighting] approach) and C-statistic values for RFS. Our prognostic model (green line) is compared to stratification by MRD status at 4 months post-diagnosis (light blue line). Their combined model (red line) is compared to stratification by MRD status at 4 months post-diagnosis and original study protocol stratifications (dark blue line). Significance is indicated at 2-, 4-, 6-, and 8-year time points with following symbols: oP < 0.10, *P < 0.05, **P < 0.01, ***P < 0.001