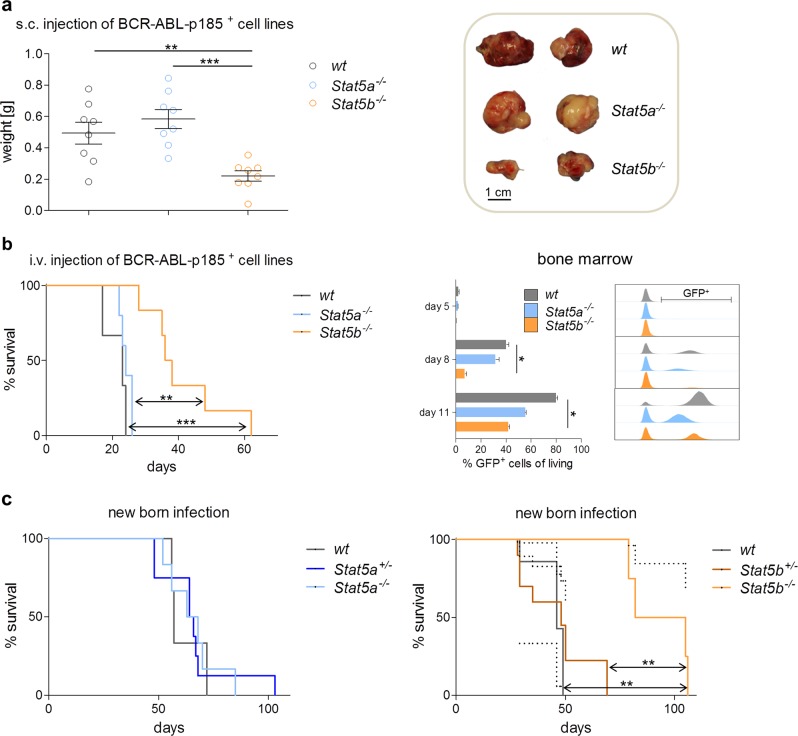
Fig. 3.
BCR/ABL-induced tumor formation in vivo is impaired upon loss of STAT5B. a Left: Subcutaneous injection of BCR/ABLp185+ established cell lines into NSG mice (n = 8 per genotype). Bar graph summarizes tumor weights. Levels of significance were calculated using one-way ANOVA. Error bars represent mean ± SEM. Right: Representative pictures of tumor sizes are depicted. b Kaplan–Meier plot of NSG mice that have received an intravenous injection (i.v.) of wt, Stat5a−/−, or Stat5b−/− BCR/ABLp185+ cells (n ≥ 6 per genotype). Log-rank (Mantel–Cox) test was used to calculate levels of significance. Right: I.v. injection of wt, Stat5a−/−, or Stat5b−/− BCR/ABLp185+ cells into NSG mice. Three mice per genotype were sacrificed on day 5, day 8, and day 11 upon injection of BCR/ABLp185+ cells. Quantitative analysis via FACS for GFP+ BCR/ABLp185+ cells in the BM (n = 3 per genotype and day) as well as representative histograms of each day and phenotype are provided. Error bars represent mean ± SEM. Levels of significance were calculated using Kruskal–Wallis test followed by Dunn’s test. c Survival plots after new-born infections using Ab-MulV (encoding v-abl) comparing left: wt, Stat5a+/−, and Stat5a−/− mice (n ≥ 3 per genotype) or right: wt, Stat5b+/−, and Stat5b−/− mice (n ≥ 4 per genotype). Log-rank (Mantel–Cox) test was used to calculate levels of significance. NSG NOD.Cg-Prkdcscid Il2rgtm 1Wjl/SzJ, ANOVA analysis of variance, IFN interferon, STAT signal transducers and activators of transcription, wt wild type, GFP green fluorescent protein

