Fig. 5.
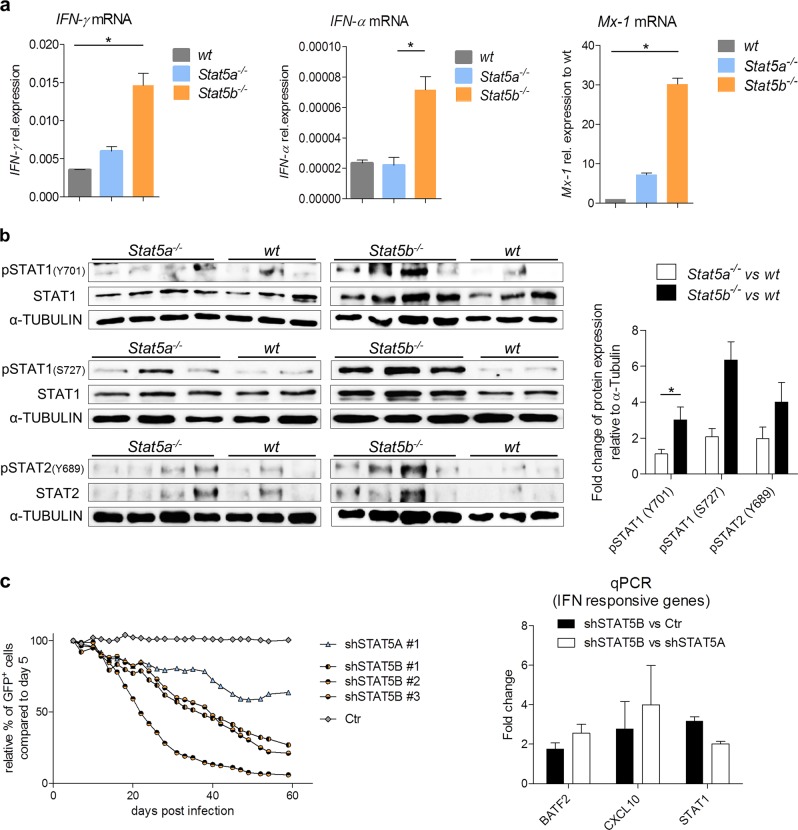
IFN-α and IFN-γ responses are impaired in BCR/ABLp185+ Stat5b−/− cells. qPCRs of wt, Stat5a−/−, or Stat5b−/− BCR/ABLp185+ cell lines for a IFN-γ, IFN-α, and Mx-1 mRNA expression (n ≥ 3 cell lines/genotype). Error bars represent mean ± SEM. Levels of significance were calculated using Kruskal–Wallis test followed by Dunn’s test. b Protein levels of pSTAT1(pS727, pY701), pSTAT2(pY698), STAT1 and STAT2 in wt, Stat5a−/−, or Stat5b−/− BCR/ABL p185+ cells as determined by immunoblotting (each lane represents an independent cell line). Right: Densitometric analysis of pSTAT1(pS727, pY701) and pSTAT2(pY698) protein levels normalized to total protein loaded and wt. Error bars represent mean ± SEM. Levels of significance were calculated via Wilcoxon–Mann–Whitney test. c Outgrowth of K562 cells expressing shRNAs against STAT5A (n = 1), STAT5B (n = 3), and Control (Ctr = Renilla, n = 1), in the presence of their non-transfected counterparts. Percentages of shRNA-expressing cells were detected by GFP expression and analyzed by flow cytometry over a period of 2 months post infection. Right: K562 cells were treated with shSTAT5A, shSTAT5B, or Ctr shRNA and sorted for GFP+ cells. Fold change of mRNA expression levels were detected via qPCR for BATF2, CXCL10, and STAT1. Error bars represent mean ± SEM. Levels of significance were calculated via Wilcoxon–Mann–Whitney test. IFN interferon, qPCR quantitative PCR, BM bone marrow, STAT signal transducers and activators of transcription, wt wild type, shRNA short hairpin RNA, mRNA messenger RNA, GFP green fluorescent protein

