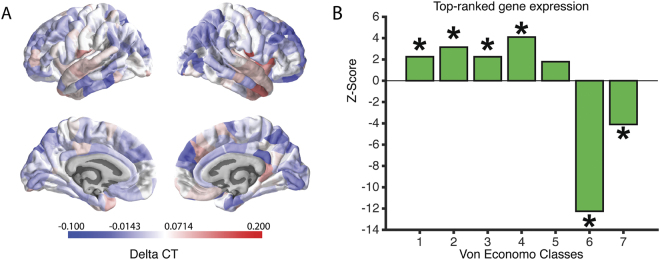
Fig. 2.
Expression and Von Economo classification for PLSR1. The heatmap in a shows the ΔCT distribution across all 308 cortical regions. The barplot in b shows the z-scores of the mean distribution across the different Von Economo Classes (Class 1: granular cortex, primary motor cortex. Class 2: association cortex. Class 3: association cortex. Class 4: dysgranular cortex, secondary sensory cortex. Class 5: agranular cortex, primary sensory cortex. Class 6: limbic regions, allocortex. Class 7: insular cortex.). All significant over- or under-expression classes are marked with an asterisk. To determine significance, we used permutation testing and an false discovery rate corrected p-value < 0.025 to fully account for two-tailed testing

