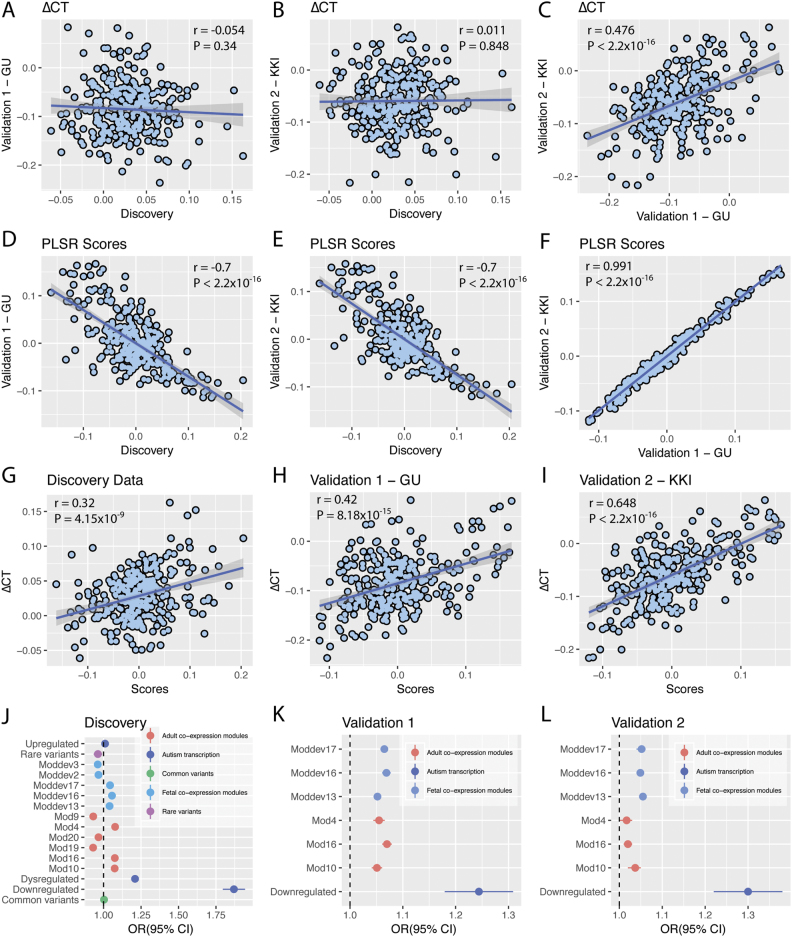
Fig. 3.
Gene enrichment and dataset comparisons. a–c Show the correlation between ∆CT in the three datasets. d–f Show the correlation between the PLSR scores of all three datasets. g–i Show the correlation between ∆CT and the PLSR scores in all three datasets (indicating that increased scores are strongly correlated with increased ∆CT). j Shows the odds ratios for the gene-enrichment analysis in the discovery dataset. All significantly enriched modules were replicated in the validation datasets (k and l) apart from module 4 of the adult co-expression modules. Pearson correlation coefficient and P-values of the correlations are provided in the top of the respective panels

