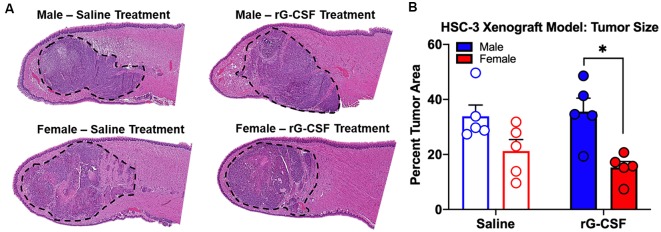
Figure 7.
HSC-3 xenograft tumor size was measured at PID 38. (A) Representative hematoxylin and eosin-stained sagittal tongue sections (100 μm from center) from male (top) and female (bottom) mice treated with either saline or rG-CSF. HSC-3 tumor is outlined in black dash line. (B) Tumor area relative to total tongue area after treatment with either saline (N = 5/sex) or rG-CSF (N = 5/sex) in male and female mice. Two-way ANOVA, *P < 0.05.

