Fig. 2.
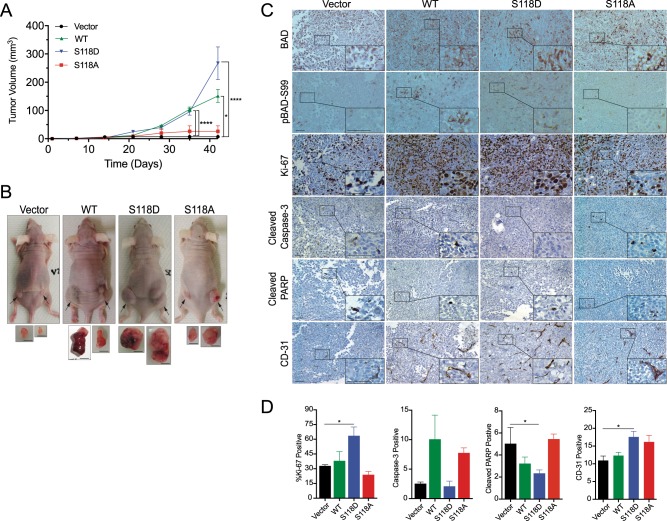
BAD expression increases tumor growth. a Mean tumor volume of indicated MDA-MB-231 xenograft tumor ± SEM (vector n = 4, WT-BAD n = 4, BAD-S118D n = 6, and BAD-S118 n = 4). b Representative images of endpoint animals and excised tumors. Black arrows indicate tumor location. Scale bar = 0.5 cm. c Representative immunohistochemistry of subcutaneous tumors stained with indicated antibodies. Scale bar = 50 μm. d Quantification of mean immunohistochemical staining from 10 random fields of view per individual tumor. Ki-67-positive cells were quantified as a percentage of total cells per field of view. Cleaved caspase-3, cleaved PARP, and CD-31-positive cells were quantified as the absolute number of positive cells per field of view (error bars ± SEM)

