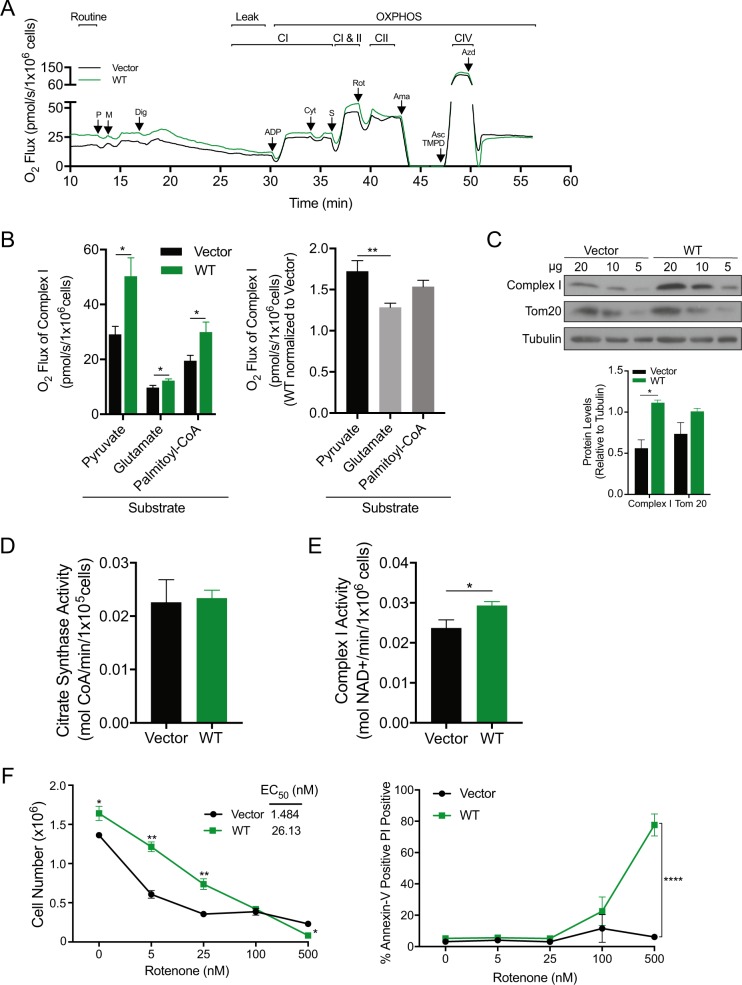
Fig. 7.
BAD increases complex I activity of the ETC. a, b MDA-MB-231 cell lines expressing pcDNA3.2-V5-DEST vector control and WT-BAD were grown normally in complete growth conditions for 72 h prior to respirometry analysis. a Representative experiment showing oxygen flow as a function of time. Respiration is expressed in pmol oxygen per second per million cells. Arrows indicate the times of titrations. Abbreviations used: pyruvate (P), malate (M), digitonin (Dig), adenosine diphosphate (ADP), cytochrome c (Cyt), succinate (S), rotenone (Rot), antimycin A (Ama), tetramethyl-phenylenediamine (TMPD), ascorbate (Asc), and azide (Azd). b Graphical representation of oxygen flux of complex I activity with the indicated substrates (error bars ± SEM of minimum 5 independent experiments). c MDA-MB-231 cell lines expressing pcDNA3.2-V5-DEST vector control and WT-BAD were probed for complex I and Tom20 levels. Decreasing concentrations of protein were analyzed (paired student’s t-test at 20 μg concentration; error bars ± SEM of 3 independent experiments). d-e MDA-MB-231 cell lines expressing pcDNA3.2-V5-DEST vector control and WT-BAD. d Citrate synthase activity was measured at 412 nM and normalized to cell number (error bars ± SEM of 3 independent experiments). e Complex I activity was measured at 540 nM and normalized to cell number (error bars ± SEM of 4 independent experiments). f Cells were delivered the indicated concentrations of rotenone for 5 days prior to flow cytometric analysis with Annexin V-647/PI staining. Left: Living cell number was determined by gating the healthy cell population using BD Accuri C6 software. EC50 was determined using GraphPad Prism software. Right: The Annexin V-647 positive/PI positive population is graphed (error bars ± SEM of 3 independent experiments)

