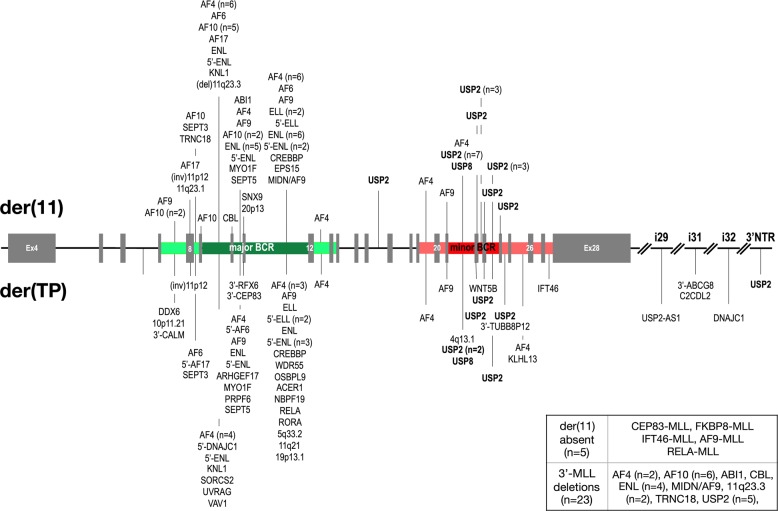
Fig. 2.
Detailed distribution of all breakpoints in both BCRs of MLL. The MLL gene is depicted from exon 4 to the end. The major BCR is marked in green, the minor BCR in red. Main breakpoint regions are depicted in dark green/red while regions with fewer breakpoints are depicted in light green/red. The fusions sites and the fusion partners are shown. Information about the 5 cases with no der(11) or the 23 cases with 3′-MLL deletions are given in the box at the right bottom

