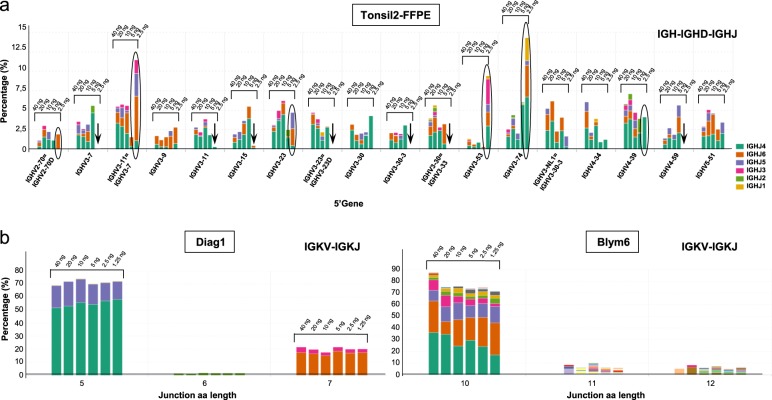
Fig. 4.
Sensitivity of next-generation sequencing (NGS)-based clonality assessment on lymphoid tissue and lymphoma specimens. a The abundance of IG gene rearrangements and the relative distribution of clonotypes was analyzed using decreasing concentrations of Qubit-quantified input DNA for each multiplex PCR reaction, ranging from 40 to 2.5 ng, of a formalin-fixed paraffin-embedded (FFPE) tonsil specimen (Tonsil2). At 2.5 ng input DNA several IGHV-IGHD-IGHJ sequences showed evidence of pseudoclonality (indicated by circles) or were not detected at all (indicated by arrows). b Two clonal B cell lymphoma specimens (Diag1 and Blym6) were tested in NGS-based clonality analysis using decreasing amount of input DNA (40–1.25 ng). The data as obtained for IGKV-IGKJ gene rearrangement analysis is presented, with detection of the abundant clone even at 1.25 ng input DNA. The green (IGKV5-2/IGKJ2) and orange (IGKV1D-8/IGKJ4) bar of Diag1 represent bi-allelic IGKV-IGKJ gene rearrangements. The green (IGKV1(D)-39/IGKJ2 = J3) and orange (IGKV1(D)-39/IGKJ2) bars of Blym6 represent the same clonotype but ARRest/Interrogate distinguished two variants, since the sequence of the IGKJ gene was assigned differently. The purple, pink, and other colored bars represent additional minor clonotypes

