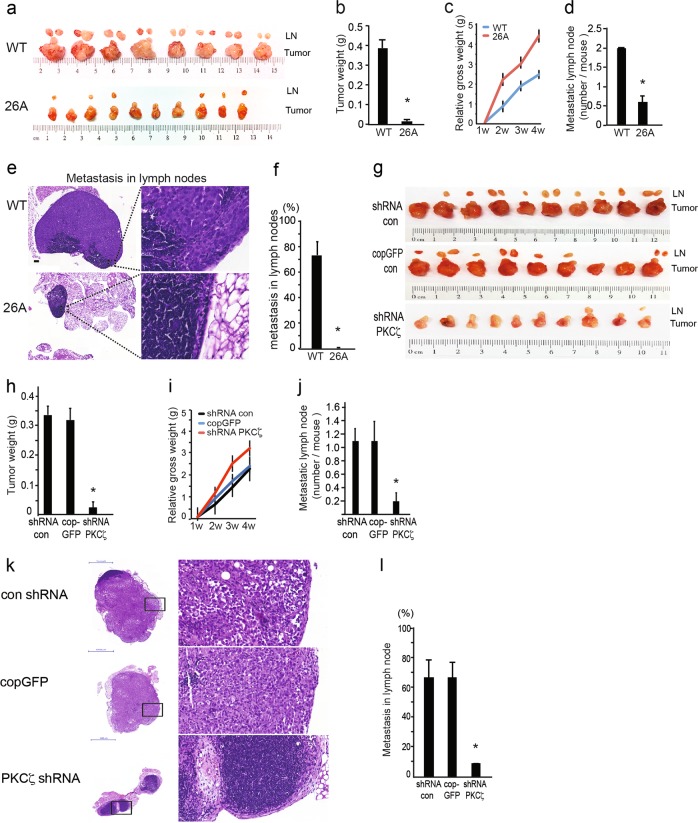
Fig. 5.
Knockout or knockdown of PKCζ inhibits tumor growth and lymphatic metastasis in an orthotopic xenograft mouse model. a WT PC3U and PKCζ-knockout 26A cells were injected into the prostate of mice. Tumors and the regional lymph nodes (LNs) were obtained after 4 weeks, WT tumor n = 8, LN n = 16; 26A tumor n = 10, LN n = 6. b Mean value of tumor weight ± S.E.M. for WT (n = 8) and 26A group (n = 10), *p ≤ 0.05, Mann–Whitney non-parametric test. c Analysis of the gain of body weight in mice with tumor burden by measuring the mouse’s gross weight during tumor growth. Bar graph shows the mean ± S.E.M. from WT (n = 8) and 26A (n = 10) group. * p ≤ 0.05, students’ t tests. d Quantification of metastatic LNs shows mean ± S.E.M from WT (n = 8) and 26A (n = 10), *p ≤ 0.05, Mann–Whitney non-parametric test. e Representative images of metastatic lymph nodes by Hematoxylin-eosin (H&E) staining. Scale bar, 200 μm. f Quantification of the invasive area occupied by cancer cells in the LNs. Bar graph shows the mean ± S.E.M. from WT (n = 16) and 26A (n = 6), * p ≤ 0.05, Mann–Whitney non-parametric test. g PC3 cells, stably transfected with control shRNA, cop GFP control, or PKCζ shRNA lentiviral particles, were injected into the prostate of mice, and the tumors and the regional lymph nodes (LNs) were collected after 6 weeks, con shRNA group n = 10, LN n = 12; cop GFP group: tumor n = 9, LN n = 10; PKCζ shRNA group n = 10, LN n = 2. h Mean value of tumor weight ± S.E.M. for con shRNA (n = 10), cop GFP control (n = 9), and PKCζ shRNA group (n = 10), * p ≤ 0.05, Mann–Whitney non-parametric test. i Analysis of the gain of body weight in mice with tumor burden by measuring the mouse’s gross weight during tumor growth. Bar graph shows the mean ± S.E.M. from con shRNA (n = 10), cop GFP control (n = 9), and PKCζ shRNA group (n = 10). j Quantification of metastatic LNs shows mean ± S.E.M. from con shRNA (n = 10), cop GFP control (n = 9), and PKCζ shRNA group (n = 10). * p ≤ 0.05, Mann–Whitney non-parametric test. k Representative images of metastatic lymph nodes by Hematoxylin-eosin (H&E) staining. Scale bar, 1000 μm. f Quantification of the invasive area occupied by cancer cells in LNs. Bar graph shows the mean ± S.E.M. from con shRNA (n = 12), cop GFP control (n = 10), and PKCζ shRNA group (n = 2), *p ≤ 0.05, Mann–Whitney non-parametric test

