Fig. 1.
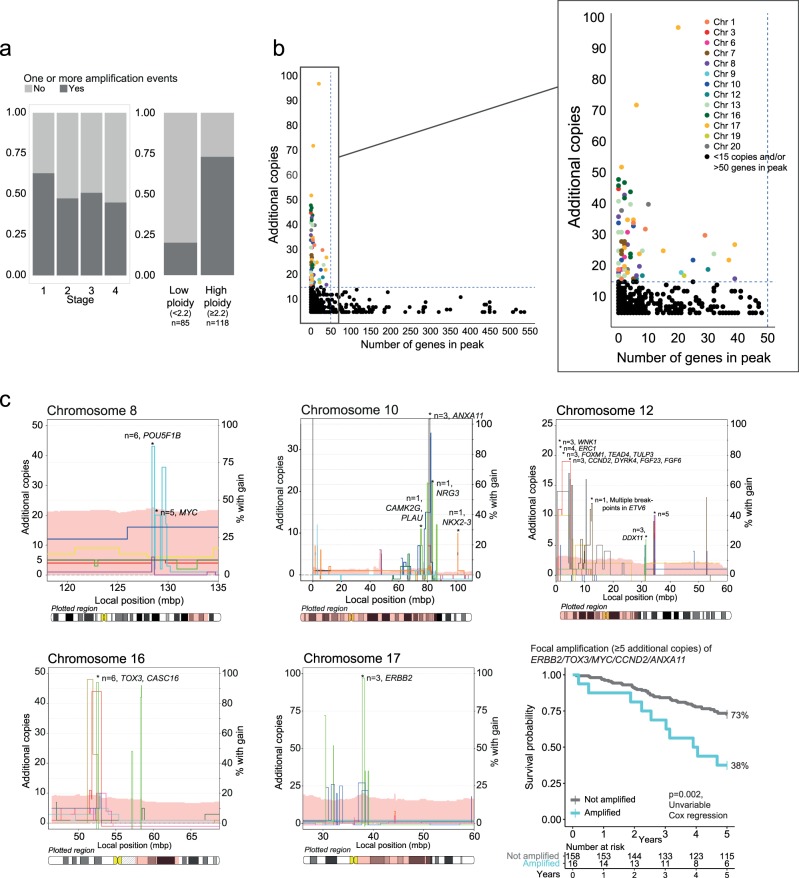
Recurrent high-level amplifications in CRC (a) The fraction of tumors with at least one amplification event was not associated with stage, but was substantially higher in high-ploidy tumors compared to low-ploidy tumors. b We identified a clear separation between focal and broad amplifications at approximately 15 additional copies and 50 genes in peak. Focal amplifications were distributed across multiple chromosomes (zoomed). c On five of the chromosomes with recurrent focal high-level amplifications (≥15 additional copies, <50 genes in peak), additional tumors had focal amplifications with ≥5 additional copies. Including all these amplicons, the amplification frequency was 1.5% (three tumors) for ANXA11 (10q), CCND2 (12p) and ERBB2 (17q); 2.5% (five tumors) for MYC (8q); and 3% (six tumors) for TOX3 (16q). Combined survival analysis showed that the 16 stage I-III MSS patients displaying focal amplifications (with ≥5 additional copies) in either of the five genes demonstrated a significant association to poor patient outcome. Chromosome plots: Left y-axis: number of additional copies above median copy number (different colored lines represent different tumors). Right y-axis: the percentage of samples with gain in the region of interest, visualized as a light pink band behind the lines indicating individual tumors

