Fig. 3.
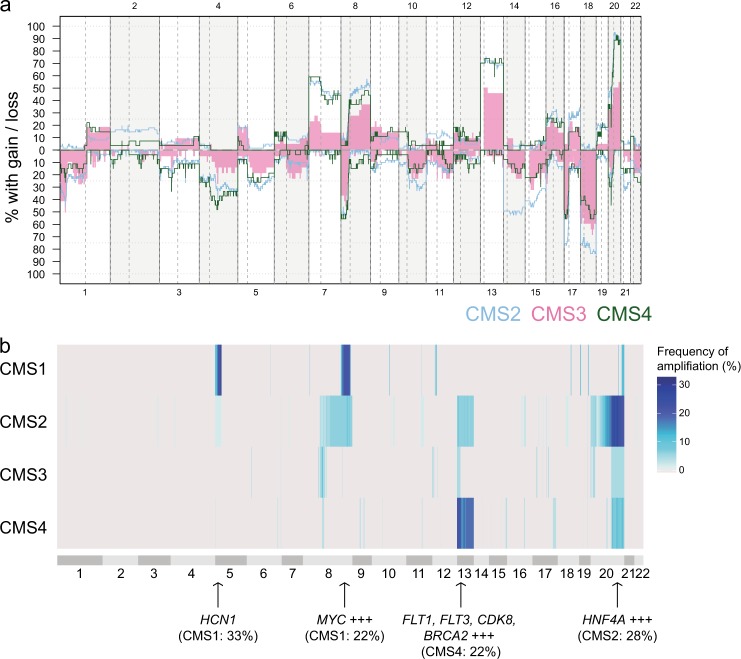
Copy number aberrations relate to CMS (a) Frequency of copy number gain and loss in 119 CMS classified MSS tumors, shown according to CMS subtype. CMS1 MSS were excluded from the plot due to low sample size (n = 9), gains and losses in CMS1 MSS were included as a separate plot in Supplementary Fig. 1e. Blue: CMS2, pink: CMS3, green: CMS4. b The four CMSs differed in the frequencies of amplifications (≥5 additional copies) across the genome (n = 119 MSS tumors). The length of the chromosome bands reflects the number of DNA segments and does not directly represent genomic positions. The figure includes data from CMS1 n = 9, CMS2 n = 61, CMS3 n = 22, CMS4 n = 27

