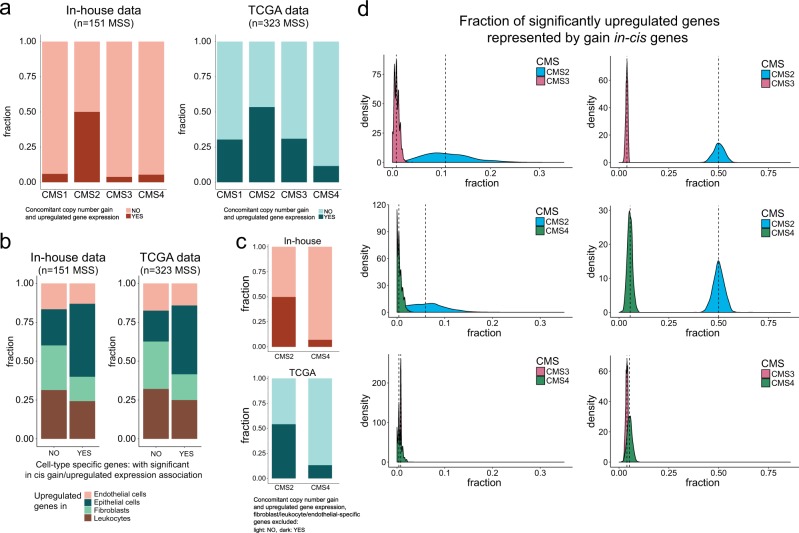
Fig. 4.
CMS2-associated gene expression profiles are associated to copy number gain. a Compared to other subtypes, CMS2 tumors had a substantially larger fraction of significant upregulated genes (limma analysis) that were also associated with copy number gain (in an in cis manner), both in the inhouse cohort and in TCGA data. b Analyses of both inhouse and TCGA data revealed that epithelial-specific genes were enriched among genes with significant association between in cis gain and upregulated gene expression, compared to genes preferentially expressed in endothelial cells/leukocytes/fibroblasts. c When depleting the list of preferentially expressed genes of fibroblast/endothelial/leukocyte-specific genes, the proportion of genes with significant in cis gain/upregulation remained around 50% in CMS2 and below 15% for CMS4 in both the inhouse and the TCGA cohorts. d Left panel: We performed random sampling (n = 1000 iterations) of 20 tumors from each subtype with subsequent pairwise calculation of the fraction of CMS-specific upregulated genes consisting of genes in the gain/upregulation category (CMS2 versus CMS3, CMS2 versus CMS4 and CMS3 versus CMS4; CMS1 was excluded due to the low sample number). Specifically, we randomly sampled 250 differentially upregulated genes from the original results on differential gene expression (performed on all CMS classified tumors) and calculated significant gain/upregulated genes separately for each iteration on the 40 sampled tumors. The figure shows the density distribution of fractions calculated for the 1000 iterations. Comparing CMS2 and CMS3, CMS2 had the largest fraction of differentially upregulated genes represented by gain/upregulated genes in all 1000 iterations. Comparing CMS2 and CMS4, CMS2 had the largest fraction of upregulated genes represented by gain in cis genes in 99.4% of the iterations. CMS3 and CMS4 were more similar, with CMS3 having a higher fraction in 64% of the iterations. Right panel: Random repeated sampling of 250 differentially upregulated genes and 250 gain in cis genes (n = 1000 iterations) from the original analyses corroborated that CMS2 had a substantially higher fraction of upregulated genes represented by in cis genes compared to other subtypes also when we controlled for the effect of different number of upregulated genes in each CMS group

