Fig. 2.
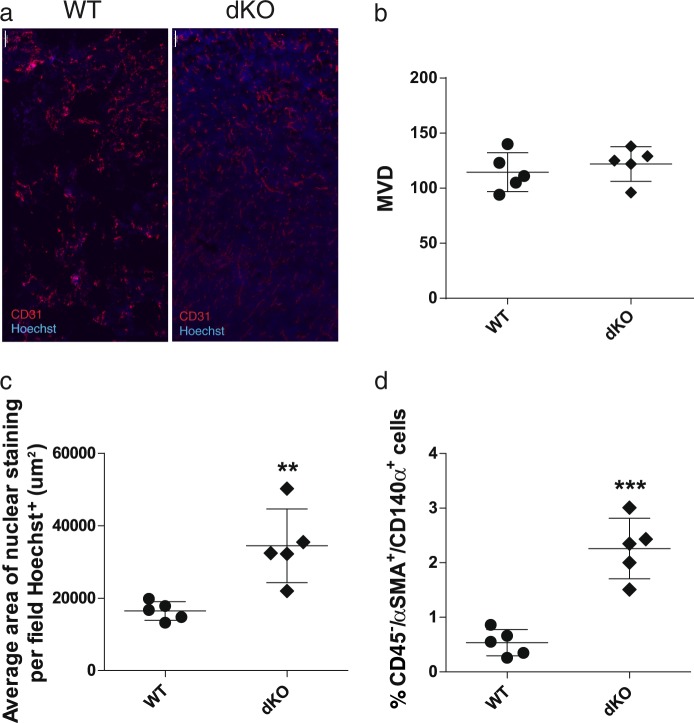
Tumors developed in dKO mice display higher blood vessel perfusion and fibroblasts recruitment. a Representative images of LLC tumor sections derived from WT and dKO mice, stained with anti-CD31 (endothelial cells; red) and Hoechst (nuclei; blue). Scale bar, 100 µm. b, c Quantification of micro vessel density (MVD, b) and nuclear staining area representing perfusion (c) per field. Each dot represents the mean of 5 fields taken from one mouse. Data are presented as mean ± SD, n = 5, Student’s t-test, **p < 0.01. d Single cell suspensions of tumors derived from WT or dKO mice immunostained for fibroblasts (CD45neg/αSMA+/CD140α+) and analyzed by flow cytometry. Each dot represents one mouse. Data are presented as mean ± SD, Student’s t-test, n = 5, ***p < 0.001. Representative images of at least three experiments

