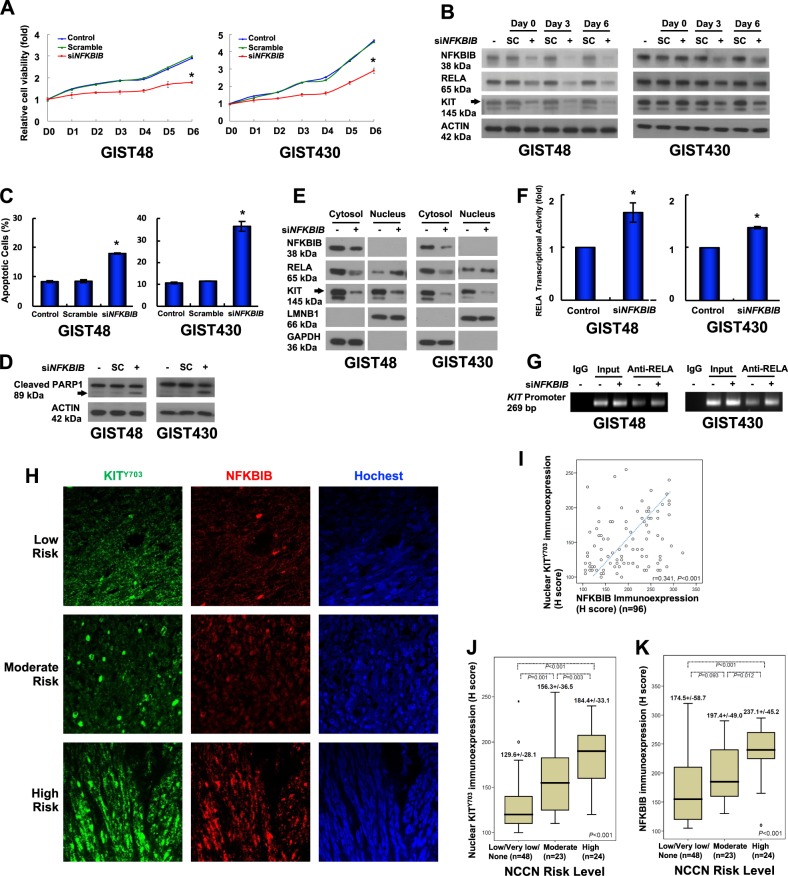
Fig. 3.
Role of KIT-regulated NFKBIB in GIST cell function. a, b GIST48 and GIST430 cells were transfected with 150 nM siRNA targeting NFKBIB or a scrambled control (SC) for 18 h. a The transfected cells were suspended, and equal numbers of cells were seeded into 24-well plates. After 6 h, the cells were attached and examined as the day 0 (D0) control, and the other cells were examined at the indicated times using a relative cell viability assay. b The cells were lysed and analyzed by immunoblotting. Actin served as an internal control. c–g Cells were transfected with siRNA targeting NFKBIB or a scrambled control for 72 h. The cells were analyzed by Annexin V staining (c) or immunoblotting against PARP1 (d). e The transfected cells were separated into cytoplasmic and nuclear fractions and analyzed by immunoblotting. LMNB1 and GAPDH were used as nuclear and cytoplasmic markers, respectively. f Nuclear proteins were used to analyze the RELA transcriptional activity. g Chromatin from the transfected cells was cross-linked, sheared, immunoprecipitated using an anti-RELA antibody, and amplified by PCR. Chromatin that was sheared but not immunoprecipitated was used as an input control. All experiments were repeated at least three times. h Representative GIST tissue samples were analyzed by immunostaining against p-KIT (KITY703; green) and NFKBIB (red) and visualized by confocal microscopy. Using photomicrographs, GISTs were classified as low-risk, moderate-risk, or high-risk according to NCCN consensus criteria based on increasing mitoses. i The scatter plot showed the correlations between 96 GIST tissues with various risk levels and the H-scores of the immunoexpression levels of nuclear KITY703 and NFKBIB. The box plot showed the associations between the nuclear KITY703 (j) and NFKBIB (k) immunoexpression levels and the H-scores for tumor grade based on the NCCN risk level according to the Kruskal–Wallis test. The middle line demonstrated the median, the box illustrated the interquartile range, and the whiskers indicated the extreme data points >1.5x the interquartile range from the box. *p < 0.05

