Fig. 6.
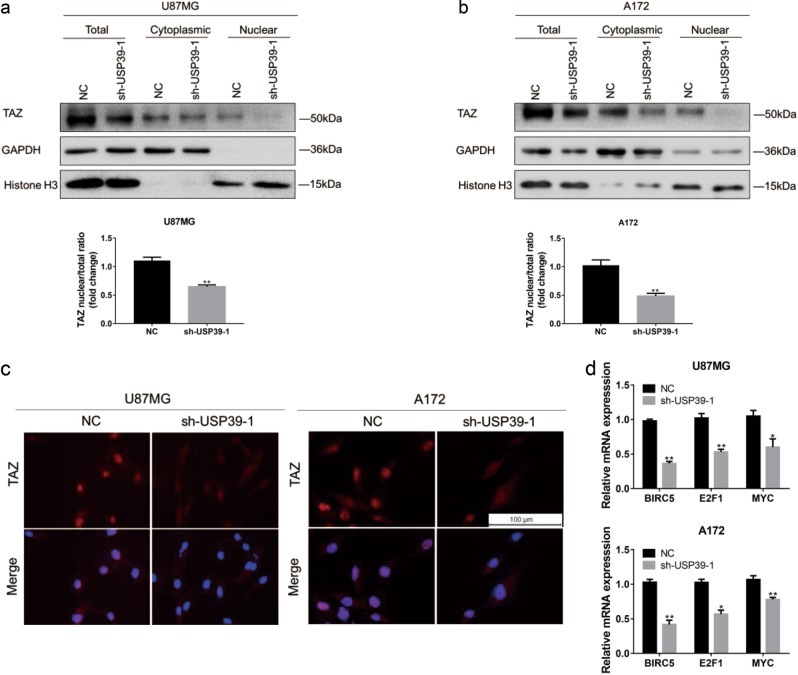
Downregulation of USP39 decreases TAZ transcriptional activity. a, b Western blotting analysis of total, cytoplasmic, and nuclear fractions prepared from indicated cells. Bar graph showing the ratio of TAZ nuclear protein (normalized to Histone H3) to total protein (normalized to GAPDH) levels in modified and control (NC) cells. c Representative images of immunofluorescence for TAZ (red) in indicated cells. Nuclei are stained with DAPI (blue). Scale bars, 100 µm. d qRT-PCR analysis for expression of TAZ target genes in U87MG- or A172-sh-USP39-1 compared with controls. GAPDH was used for normalization. Student’s t-test: n.s. = not significant, *p < 0.05, **p < 0.01, ***p < 0.001

