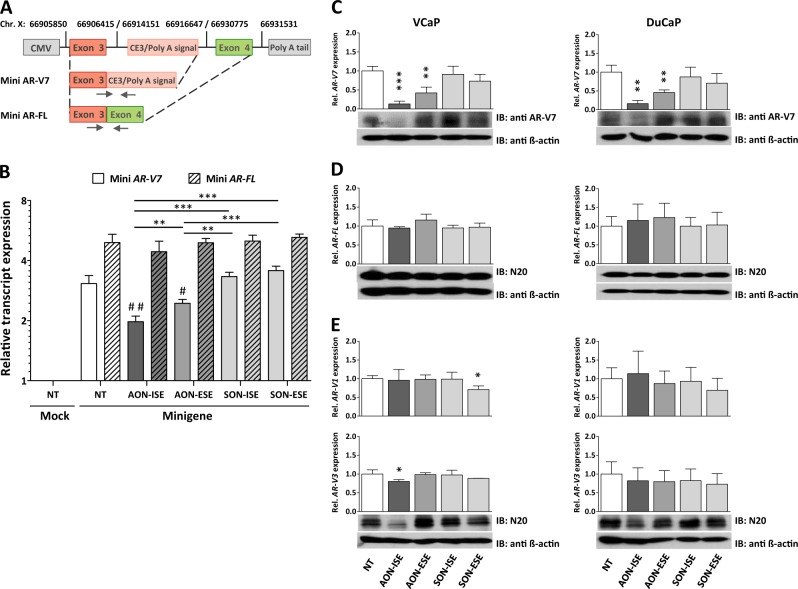
Fig. 2.
Antisense oligonucleotide (AON)-mediated AR-V7 knockdown. a Schematic diagram (not to scale) of the androgen receptor (AR) minigene construct. Minimal regions containing AR exon 2, cryptic exon 3 (CE3), exon 4 and their flanking regions are cloned into a CMV-driven pEGFP-N3 expression vector. Vertical lines mark positions of each AR gene fragment on chromosome X (Human Genome Assembly February 2019, HG19). Primers for RT-qPCR are marked with headed arrows. b AR-negative MIA PaCa-2 cells were transfected with 500 ng AR minigene vector or with empty vector and with 0.5 µM AONs (AON-intronic splicing enhancer (ISE) and AON-exonic splicing enhancer (ESE)) or control sense oligos (SON-ISE and SON-ESE). Relative expression of AR-FL and AR-V7 from the AR minigene were measured by RT-qPCR analysis, four days after transfection. Unpaired t-test; **p < 0.01; ***p < 0.001. AON-treated vs non-treated cells; #p < 0.05 and ##p < 0.01. Bars represent the mean ± SD of three independent experiments. c–e Expression levels of AR-V7, AR-FL, AR-V1, and AR-V3 in DuCaP and VCaP cells (determined by RT-qPCR), 4 days after transfection with 0.2 µM AONs or control oligos. Expression levels were compared with non-transfected cells (NT). Below each graphs, western blot analysis of AR-V7 (anti-AR-V7), AR-FL (N20), and truncated AR-Vs (N20) protein levels are shown. Protein levels of β-actin (anti-β-actin) were used as protein loading control. Unpaired t-test; *p < 0.05; **p < 0.01; ***p < 0.001. Bars represent the mean ± SD of three independent experiments

