FIGURE 2.
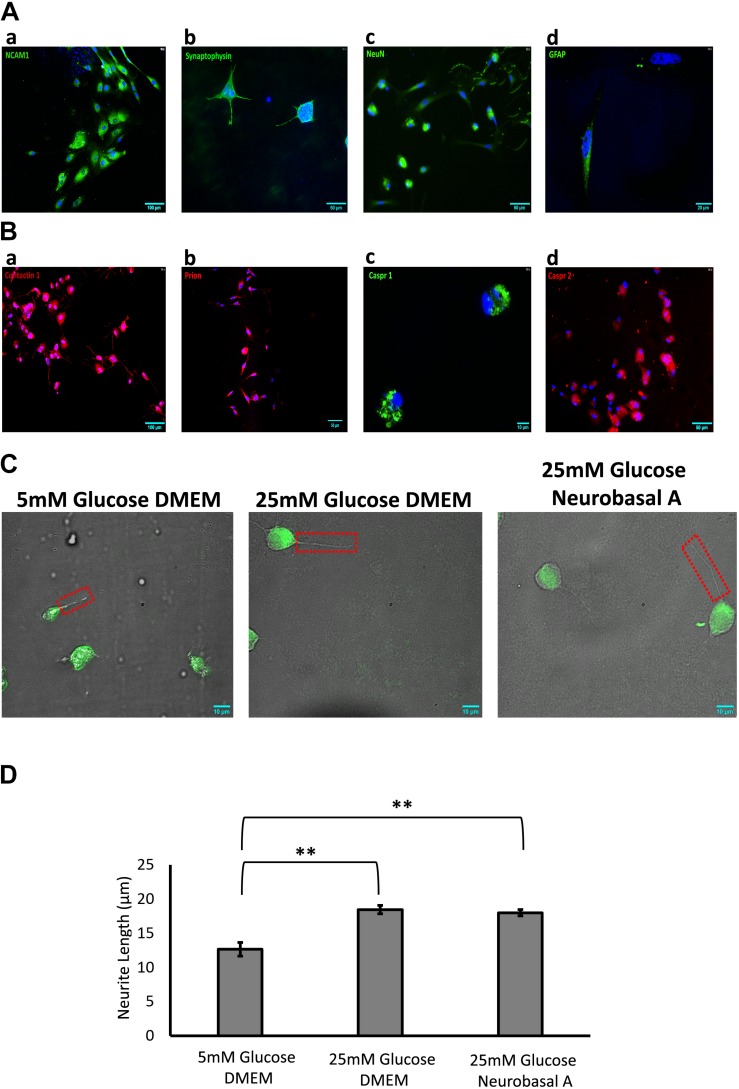
(A) Identification of adult retinal neurons and glia in culture by immunofluorescence staining. (a) NCAM1 (green), expressed by all retinal neurons and glia; (b) Synaptophysin (green), expressed by neurons in the plexiform layers of the retina; (c) NeuN (green), expressed by neuronal nuclei; (d) GFAP (green), expressed by retinal glia. (B) Expression of cell adhesion molecules (CAMs) in adult retinal neurons and glial culture by immunofluorescence staining: (a) Contactin1, red (b) Prion, red (c) Caspr1, green (d) Caspr2, red. (C) Representative 60× DIC combined with NeuN (green) immunostained images showing length of neurite outgrowth (red box) in retinal neurons cultured in 5 mM glucose DMEM, 25 mM glucose DMEM, or 25 mM glucose Neurobasal A medium. (D) Quantification shows a significant increase in neurite length in 25 mM glucose-containing DMEM and Neurobasal A medium, as compared to 5 mM glucose DMEM (∗∗p < 0.01). Neurite outgrowth was measured in 50–100 cells per slide, and experiment repeated in triplicate. N = 5.

