FIGURE 4.
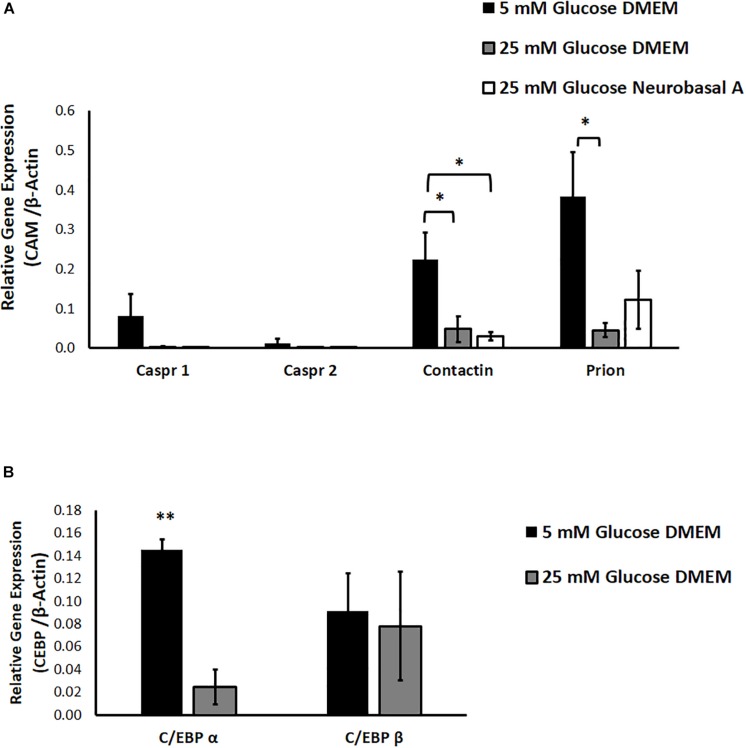
(A) The effect of hyperglycemia and media composition on expression of specific cell adhesion molecules in cultured retinal cells was quantified by RT-PCR. In 25 mM glucose DMEM and Neurobasal A medium, Contactin1 expression was significantly downregulated. In 25 mM DMEM, Prion expression was significantly downregulated. ∗p < 0.05 compared to 5 mM glucose medium. N = 4–5. (B) The effect of hyperglycemia on expression of transcription factors C/EBP α and C/EBP β in cultured retinal cells was quantified by RT-PCR. In 25 mM glucose medium, expression of C/EBP α was significantly downregulated. ∗∗p < 0.01 compared to 5 mM glucose medium. N = 3.

