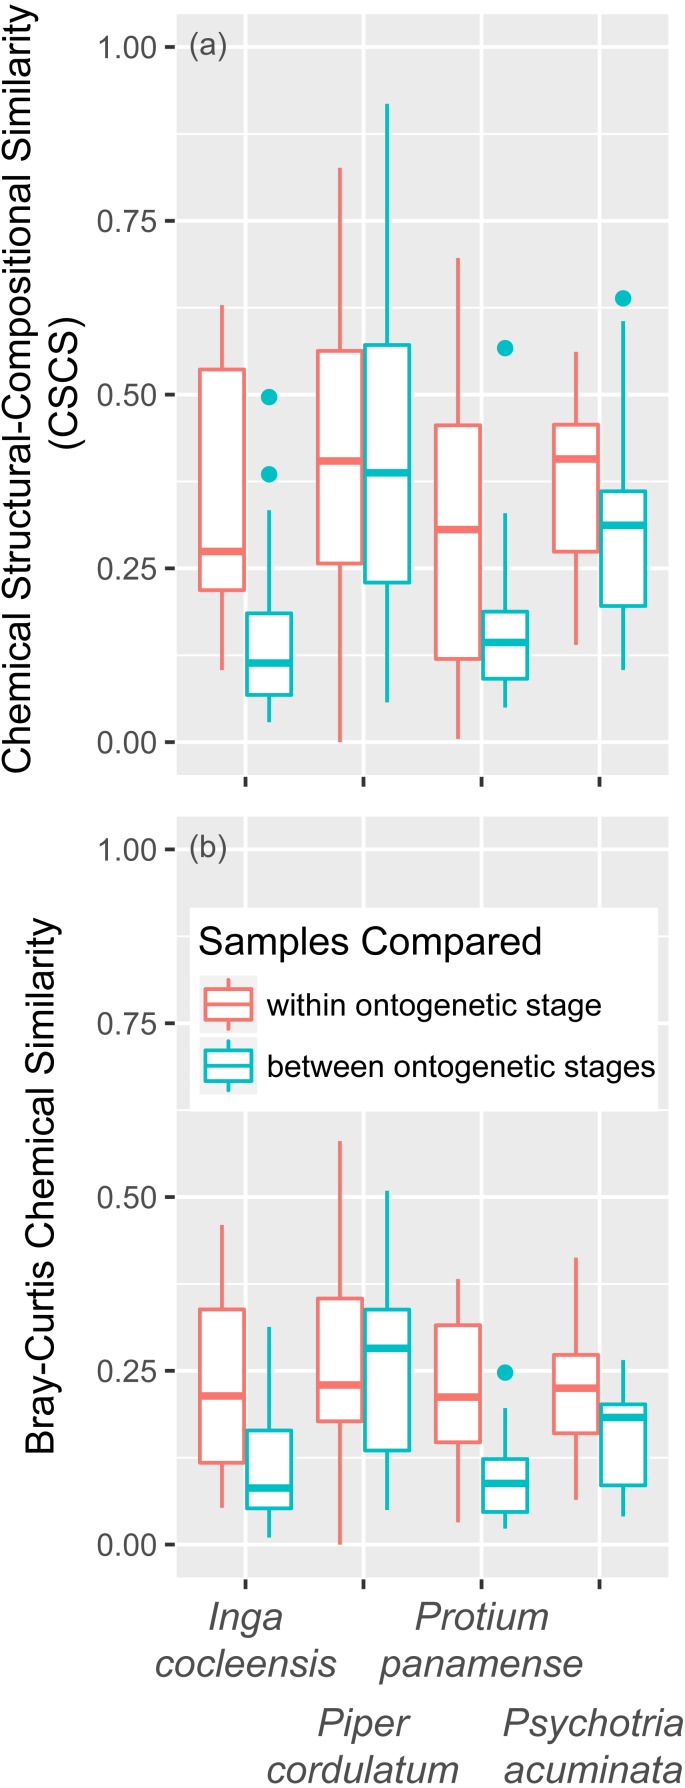
Figure 3. Chemical similarity within and between leaf ontogenetic stages.
Chemical similarity between pairs of leaf samples is represented by chemical structural compositional similarity (CSCS; A) and Bray–Curtis similarity (B). Boxplots indicate the median and the first and third quartiles of chemical similarity for pairwise sample combinations.

