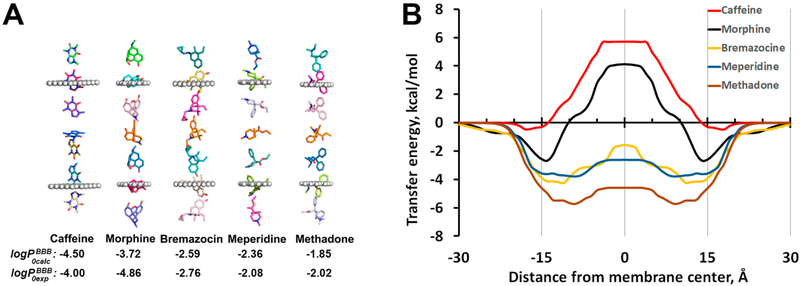
Figure 1.
Spatial positions, optimized orientations (A), and transfer energy profiles (B) calculated for several drug molecules as they move through the DOPC bilayer. Calculations of transbilayer energy profiles were performed by the publicly available PerMM web server (https://permm.phar.umich.edu/server) using the “global rotational optimization” option. The locations of hydrocarbon core boundaries between the acyl chains and head groups of lipids (at ±15 Å distances from the membrane center) are approximated by planes and shown as dummy atoms (A).

