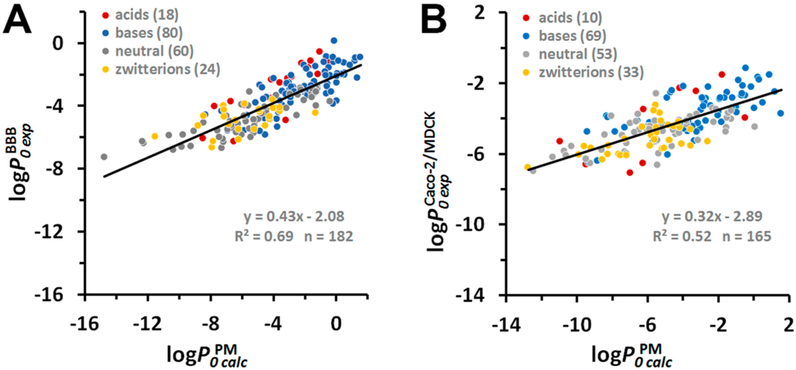
Figure 5.
Correlation between calculated intrinsic permeability coefficients through the plasma membrane (PM) and experimental intrinsic permeability coefficients through BBB (A) and Caco-2/MDCK cells (B). Intrinsic permeability coefficients of molecules through the plasma membrane were calculated using eq 16. Experimental data were taken from Tables S3 for BBB and Table S4 for Caco-2/MDCK assays . Colors indicate different types of molecules: red for acids, blue for bases, gray for neutral molecules, and yellow for zwitterions. The number of molecules “n” is indicated in parentheses.

