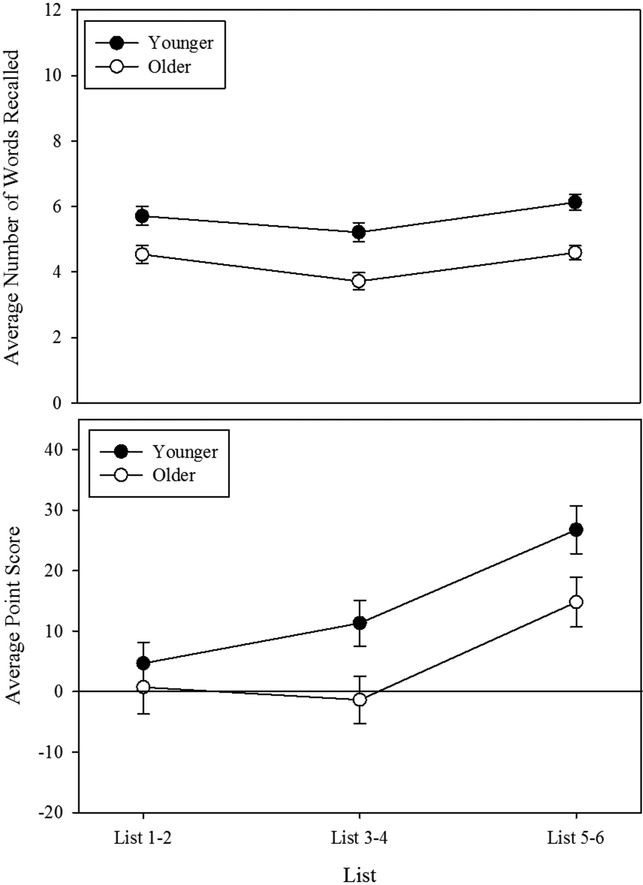
Figure 1.
Figure 1A displays the average number of words recalled by both older and younger adults across the six study-test lists in Experiment 1. Figure 1B displays the average overall point score achieved on each list by both older and younger adults in Experiment 1. Error bars represent standard error of the mean.

