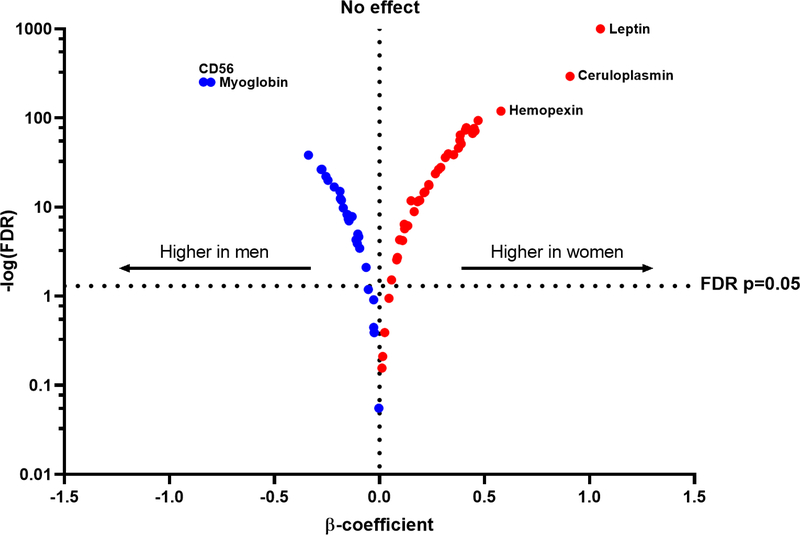
Figure 1. Multivariable-adjusted associations of single biomarkers with sex.
Volcano plot showing relative biomarker concentrations in men and women. Positive x-values (red) represent biomarkers that are higher in women and negative x-values (blue) represent biomarkers that are higher in men. Abbreviations: FDR = false discovery rate.

