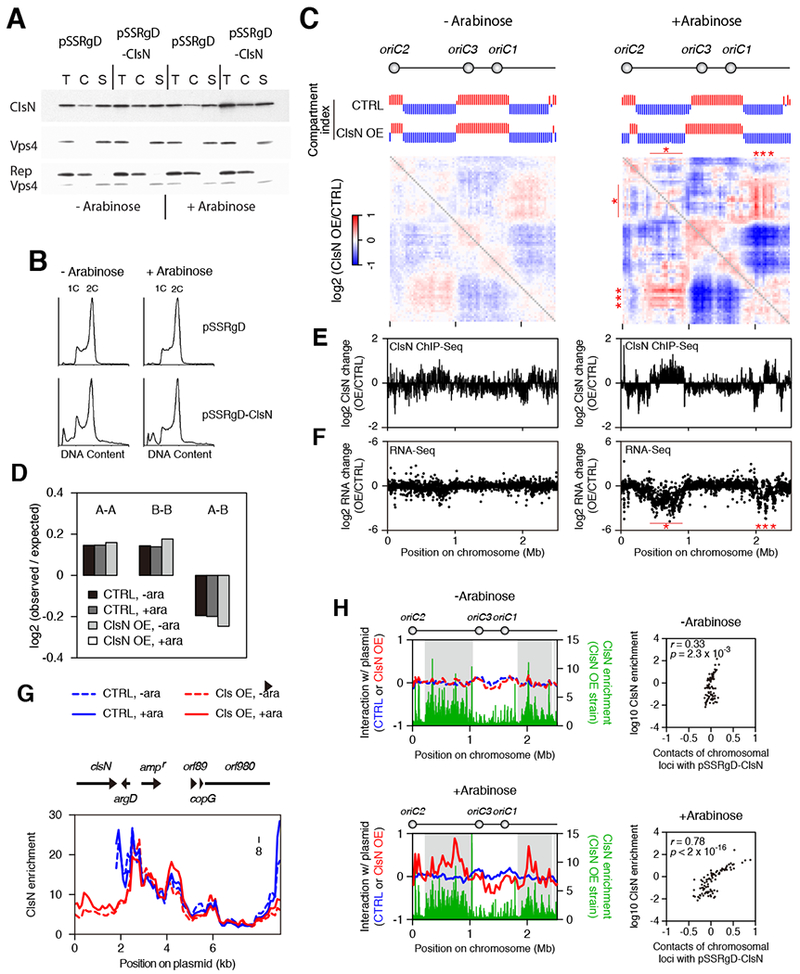
Figure 3. Coalescin Overexpression from a Plasmid leads to Enhanced Compartmentalization and Intermolecular DNA Interactions at Coalescin-enriched Sites.

(A) Chromatin fractionation of ClsN in S. islandicus before and after four hours of induction of ClsN with arabinose. Cells containing the empty vector pSSRgD or the overexpression vector pSSRgD-ClsN were used. After separating cell extract into chromatin (C) and soluble (S) fractions, total protein (T) and extract fractions were run on SDS-PAGE. ClsN and soluble and chromatin markers, Vps4 and Reptin respectively, were detected by western blotting.
(B) Flow cytometry profiles of the ClsN overexpression strain and control strain before and after four hours of induction with arabinose. Cells containing one and two chromosomes (1C and 2C) are indicated.
(C) Ratios of Hi-C interaction scores between S. islandicus strains containing either of the pSSRgD-ClsN overexpression plasmid (ClsN OE) or pSSRgD empty control vector (CTRL). Cells were collected before and after arabinose induction (“−Arabinose” and “+Arabinose” respectively). Compartment index plots are also shown where the A and B compartments are indicated by red and blue bars respectively.
(D) Distance-normalized (observed/expected) frequency of genomic contacts is shown for interactions within the A compartment (A-A), within the B compartment (B-B), and between the different compartments (A-B). Frequencies were calculated for cells containing the pSSRgD empty vector or pSSRgD-ClsN overexpression vector before and after induction with arabinose (−ara and +ara respectively). See STAR Methods for more detail.
(E) ClsN ChIP-Seq. The log2 values of changes in ClsN occupancy (at 5-kb resolution) of the overexpression strain relative to the empty vector are plotted for cells grown in before (left panel) or after (right panel) the addition of arabinose. See also Figure S6B.
(F) RNA-Seq analysis on protein-coding genes. The log2 values of Transcripts Per Million (TPM) in the overexpression strain relative to the empty vector are plotted for cells grown in the absence (left panel) or presence of arabinose.
(G) ClsN ChIP-seq profiles on plasmids at 100-bp resolution. The locations and directions of the plasmid genes are shown on top. Profiles for the pSSRgD empty vector “CTRL” are shown in blue and pSSRgD-ClsN overexpression plasmid “ClsN OE” in red, with dashed lines indicating growth in the absence of arabinose and solid lines following 4 hours of induction with arabinose.
(H) Left panels: Hi-C interaction scores between plasmids (color coding as in panel 4F) and the chromosome at 30-kb resolution. The upper panel shows the results from cells grown without arabinose, the lower panel from cells following four hours of induction with arabinose. In each dataset, values are shown as log2 ratios relative to the median. ChIP-Seq profiles of ClsN enrichment (1-kb resolution) in the over-expression strain plots are superimposed in green. Grey shading indicates the position of the B domains in the parental S. islandicus strain. Right panels: Hi-C interaction score between pSSRgD-ClsN and the chromosome are compared with ClsN enrichment for each 30-kb region of the chromosome.
See also Figure S6.
