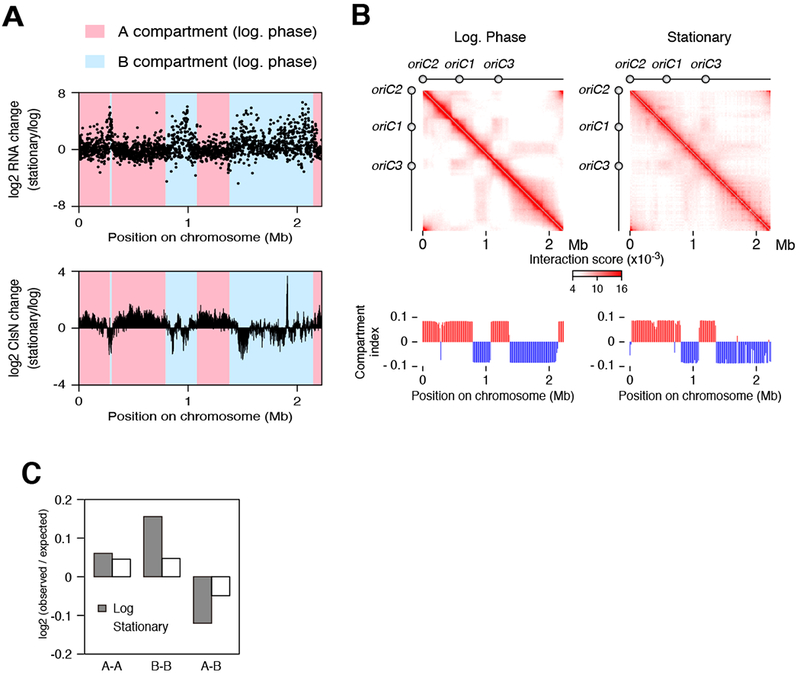
Figure 6. Transcriptome Changes in Stationary Phase are Associated With Alterations of ClsN Localization and Chromosomal Interactions.

Two biological replicates per sample were used for RNA-seq and ChIP-seq analyses.
(A) Upper panel: changes in RNA expression after the entry into stationary phase. log2fold change in RNA level (TPM) is plotted for S. acidocaldarius protein-coding genes. Lower panel: log2-fold change in ClsN enrichment is plotted for each 1-kb bin.
(B) Hi-C contact matrices and compartment index profiles of S. acidocaldarius cells in log phase (left panel) and stationary phase (right panel).
(C) Distance-normalized frequency at the various timepoints of genomic contacts within the A compartment (A-A), within the B compartment (B-B) and between A and B compartments (A-B).
