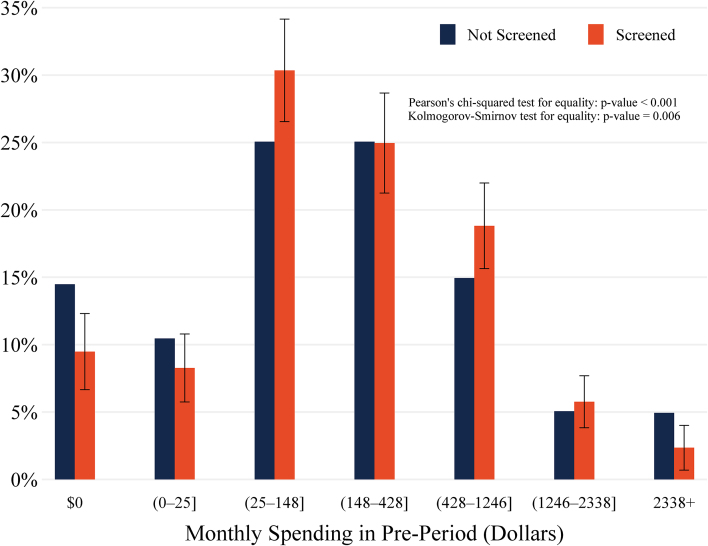
Figure III.
Preintervention Medical Spending among Treatment Group, by Participation Status
Data are from claims covering the period July 2015–July 2016 (N = 2,188). The first two bins ($0 and (0−25]) include 25% of those not screened. The remaining five bins were defined to include 25%, 25%, 15%, 5%, and 5% of those not screened, respectively. The null hypothesis of the Pearson’s chi-squared and the nonparametric Kolmogorov-Smirnov tests is that the two samples are drawn from the same distribution.

