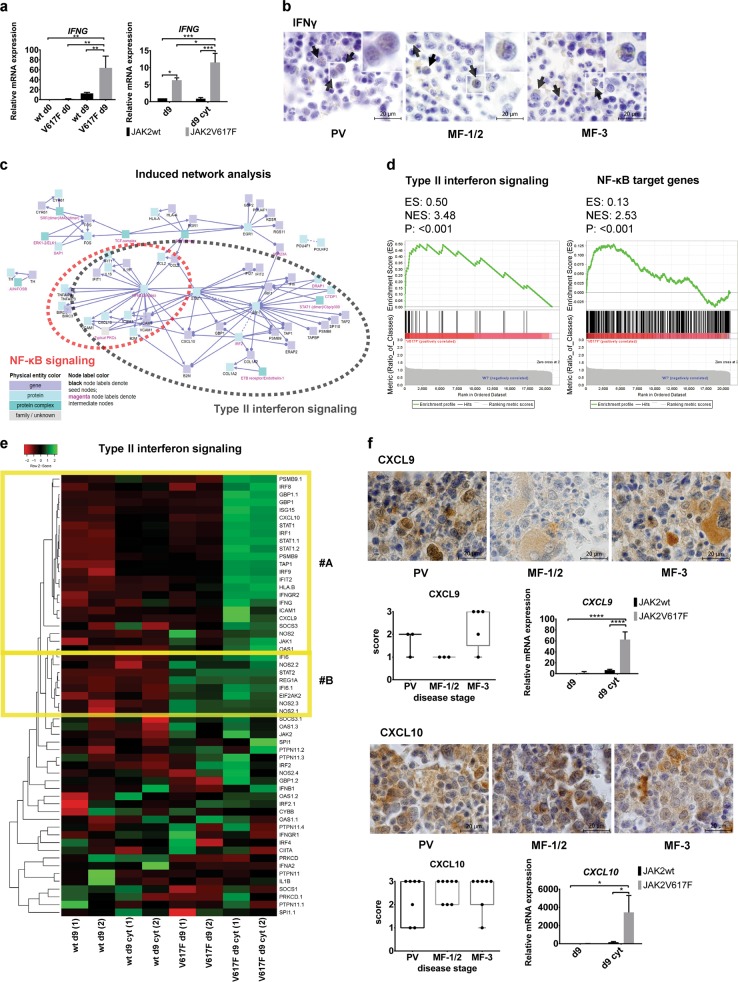
Fig. 1.
Intrinsic and proinflammatory cytokine-induced expression of IFNγ and IFNγ-regulatory program in JAK2V617F+ progenitors. a Left bar graph: intrinsic IFNG mRNA expression (mean ± SD; n = 3 independent experiments) in d9 JAK2V617F+ CD34+ P-ECs compared with d9 JAK2wt CD34+ P-ECs and with undifferentiated JAK2wt and V617F+ iPSC lines (d0). Right bar graph: IFNG mRNA expression in three independent experiments after treatment with IFNγ, TNFα, and TGFβ1 inflammatory cytokines (d9 cyt). *P ≤ 0.05, **P ≤ 0.01, ***P ≤ 0.001, one-way and two-way ANOVA, respectively. b Representative IHC staining of BM sections for IFNγ among different disease stages of PV progression. Scale bar, 20 µm. Insets in each panel show magnification of individual IFNγ-producing cells. c Visualization of induced network module analysis made by ConsensusPathDB using differentially upregulated genes (logFC > 1, q < 0.1 cut-off) between JAK2wt and V617F+ CD34+ P-ECs treated with inflammatory cytokines (d9 cyt) as seed genes with seed nodes (black) and intermediate nodes (magenta) connected through functional and physical links. Red circle depicts visualized nodes associated with NF-κB pathway, with significant type II interferon signaling genes overlap (gray circle). d Left: GSEA plot of type II interferon signaling gene set members (WikiPathway, n = 37) in d9 cyt JAK2V617F+ and JAK2wt CD34+ P-ECs. Right: GSEA of d9 cyt JAK2V617F+ and JAK2wt CD34+ P-ECs using a set of 424 NF-κB target genes (http://www.bu.edu/nf-kb/gene-resources/target-genes/). e Heatmap representation of differential expression of type II interferon signaling gene set members in d9 JAK2wt and JAK2V617F+ CD34+ P-ECs, untreated (d9) or treated with inflammatory cytokines (d9 cyt). Columns in the heatmap represent individual samples in experimental duplicates (1, 2). f IHC staining of CXCL9 and CXCL10 in representative BM sections from patients along the progression of PV. Scale bar, 20 µm. Boxplots show quantification of the number of cells expressing CXCL9 and CXCL10 in sections of patients from grouped disease stages. The bar graphs show mRNA expression (mean ± SD) of three independent experiments for CXCL9 and CXCL10 in d9 cyt JAK2V617F+ CD34+ P-ECs, compared with untreated (d9) or treated (d9 cyt) JAK2wt CD34+ P-ECs. *P ≤ 0.05, ****P ≤ 0.0001, Mann–Whitney test (IHC) and two-way ANOVA (qRT-PCR). See also Supplementary Fig. 1

