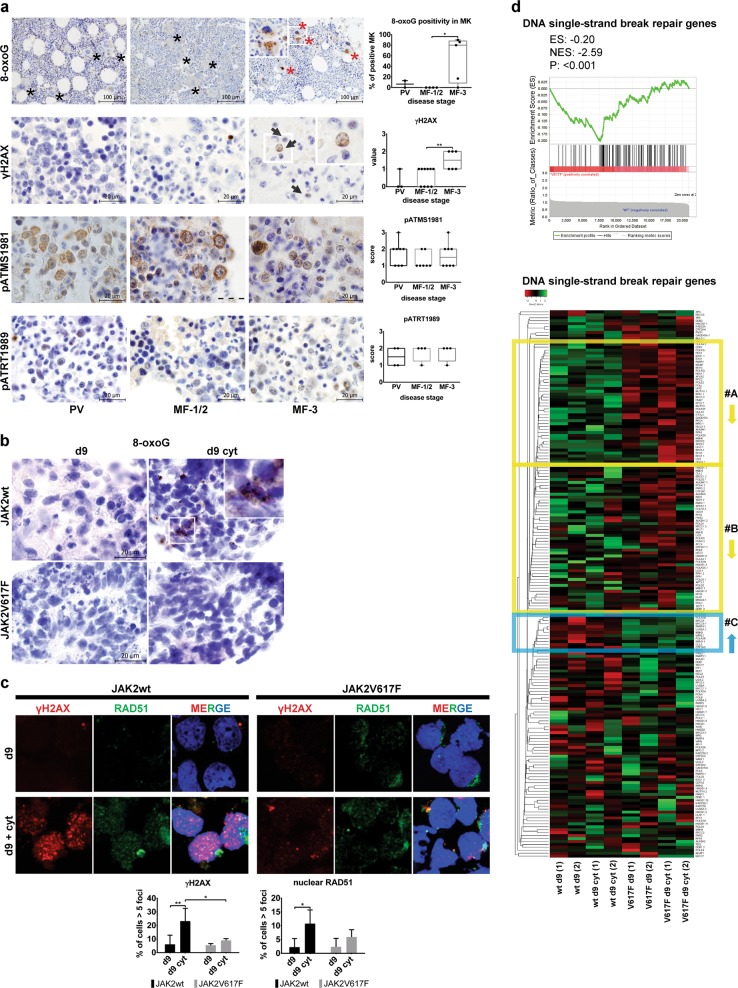
Fig. 2.
Protection against inflammation-induced DNA damage accumulation and DDR in PV cells. a Immunohistochemistry staining for oxidative DNA damage and DDR markers in PV, MF-1/2, and post-PV MF-3 patients. In 8-oxoguanine (8-oxoG) staining, red asterisks mark 8-oxoG-positive megakaryocytes (MKs), black asterisks denote negative MKs; scale bar, 100 µm. In γH2AX staining, inset in MF-3 panel shows magnification of cells stained positive for γH2AX foci; scale bar, 20 µm. pATMS1981 staining revealed cytoplasmic and pATRT1989 nuclear positivity; scale bars, 20 µm. Boxplots show quantification of the number of cells expressing indicated markers in sections of patients from grouped disease stages. *P ≤ 0.05, **P ≤ 0.01, Mann–Whitney test. b Immunostaining for 8-oxoG of paraffin-embedded EBs derived from d9 and d9 cyt JAK2wt and V617F+ iPSCs. c γH2AX (red) and RAD51 (green) staining of d9 and d9 cyt JAK2wt and JAK2V617F+ CD34+ P-ECs. Charts show percentage of cells ± SD in three independent experiments with more than five γH2AX or RAD51 foci per cell in nucleus. *P ≤ 0.05, **P ≤ 0.01, two-way ANOVA. d Top: GSEA of d9 cyt JAK2V617F+ and JAK2wt CD34+ P-ECs using a set of 112 single-strand repair genes [37]. Bottom: Heatmap representation of single-strand repair gene set expression in d9 and d9 cyt JAK2wt and JAK2V617F+ CD34+ P-ECs. Columns represent individual samples in experimental duplicates (1, 2). Two large differentially downregulated clusters of genes in V617F+ samples are highlighted by yellow box with low variance between experimental duplicates (#A) and higher variance (#B). Blue box delimits cluster of genes upregulated with low variance between experimental duplicates in V617F+ samples (#C). See also Supplementary Fig. 2

