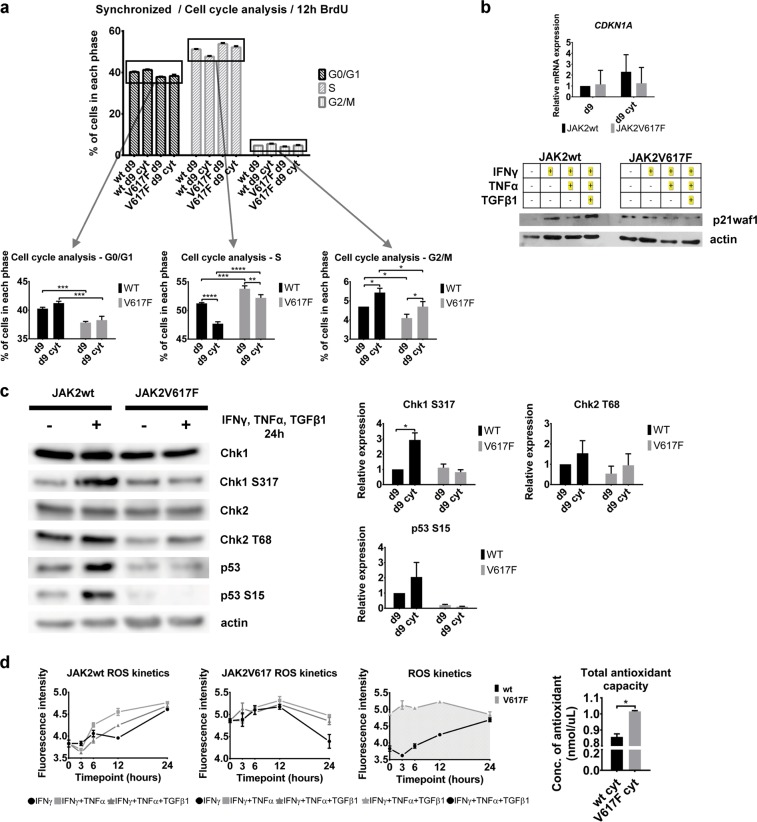
Fig. 3.
Characterization of cell cycle progression, checkpoint activation and ROS production and buffering in JAK2wt and JAK2V617F+ CD34+ P-ECs. a Changes of cell cycle profiles of synchronized CD34+ P-EC cells untreated (d9) or treated with IFNγ, TNFα and TGFβ1 for 24 h (d9 cyt). Bar charts show percentage of cell numbers ± SD from three independent experiments in each phase of cell cycle. To further express the differences in each phase of cell cycle, the top of the chart bars were zoomed-in on separate charts. *P ≤ 0.05, **P ≤ 0.01, ***P ≤ 0.001, ****P ≤ 0.0001, two-way ANOVA. b Top: Quantitative RT-PCR analysis of CDKN1A (p21waf1) gene expression in day d9 or d9 cyt JAK2wt and JAK2V617F+ CD34+ P-ECs. Values are shown as a mean ± SD of three independent experiments. Bottom: Representative immunoblotting analysis with protein levels of p21waf1 in JAK2wt and JAK2V617F+ CD34+ P-ECs upon treatment with IFNγ, TNFα, and/or TGFβ1 in various combinations. c Western blotting analysis of total and phosphorylated forms of checkpoint proteins (Chk1, Chk2, and p53) in d9 and d9 cyt JAK2wt and JAK2V617F+ CD34+ P-ECs. Charts show Chk1 S317, Chk2 T68, and p53 S15 relative expression (mean ± SD, n = 2 independent experiments) normalized to actin. *P ≤ 0.05, two-way ANOVA. d Left: Kinetics of ROS production in three independent experiments presented as a mean ± SD of samples’ fluorescence intensities in JAK2wt and JAK2V617F+ CD34+ P-ECs treated with defined combinations of inflammatory cytokines for 3, 6, 12, and 24 h (left two charts); comparison of different kinetics of ROS production in JAK2wt and JAK2V617F+ CD34+ P-ECs after treatment with IFNγ, TNFα, and TGFβ1 for 24 h (right chart). Right: Total antioxidant capacity (concentration of antioxidant ± SD, n = 2 independent experiments) in JAK2wt and JAK2V617F+ CD34+ P-ECs treated with inflammatory cytokines for 24 h. *P ≤ 0.05, unpaired Student’s t-test (two-tailed). See also Supplementary Fig. 3

